Buy the rumor, sell the fact (sell after the rumor is confirmed), buy the dip, sell the rip (buy undervalued, sell overvalued), buy the ticket, take the ride (be prepared to accept the ups and downs). Have you ever heard any of these phrases? What about chasing the elephant (following in the footsteps of influential investors) or the cockroach theory (one issue implies the existence of more hidden issues)?
Well, maybe it’s better to start with basic terms.
Start from $10, earn to $1000
1. Bull market/bear market
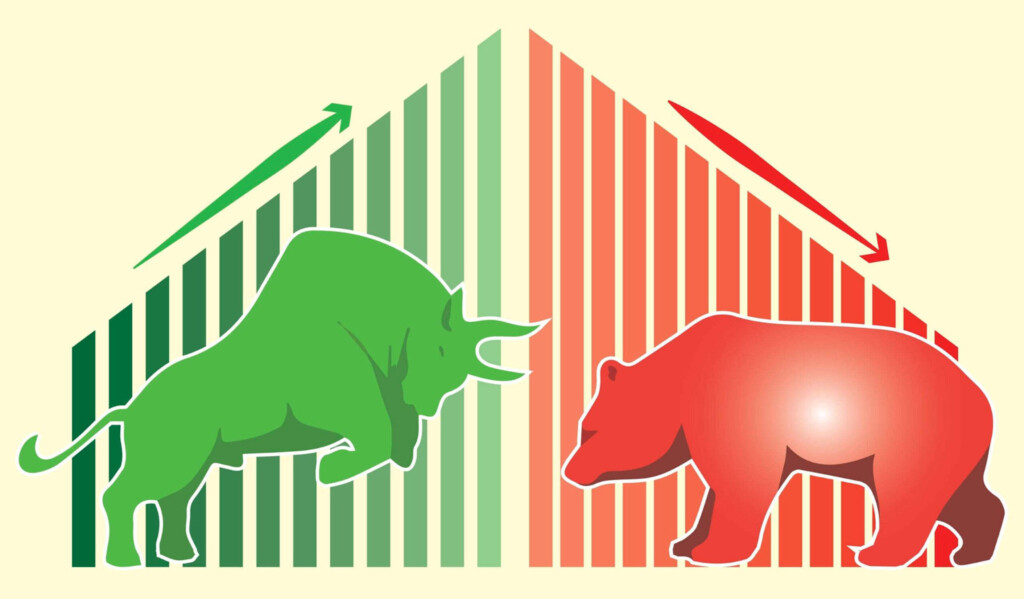
A bull market is like a charging bull that represents a period when stock prices are generally rising. It’s a time when traders feel optimistic and confident about the economy and the direction of the market. People are more likely to buy assets in this market because they expect their prices to keep going up.
A bear market is the opposite. It’s a sleeping bear that symbolizes falling prices. During a bear market, the overall sentiment is one of pessimism and caution, with traders expecting further declines in asset prices.
Effective strategies in your mailbox
Subscribe and discover a fund of trading knowledge
Great! Please check your email
We’ve sent you an email to confirm your subscription
Something went wrong
Try reloading the page. If that doesn’t help, please try again later
2. Quote
A quote is a current price at which a particular asset (a stock, commodity, or currency) is being bought and sold in the market. It provides information about its current market value.
3. Long/short

Going long refers to buying an asset expecting that its value will increase over time. When you take a long position, you believe that the price of the asset will go up. The goal is to sell it at a higher price in the future and make a profit.
Trading with up to 90% profit
On the other hand, going short means selling an asset that you don’t currently own. The intention is to buy it back at a lower price later. Here, you believe that the price of the asset will decrease, and if it does, you can repurchase at a lower price, return it to the lender (if you borrowed it), and benefit from the price difference.
How to start trading with $200 and minimum risk
Don’t let a small budget deter you from trading! Learn how to start trading with $100 or $200 and make the most out of this money!
Read more

4. Volatility
Volatility is the degree of fluctuation in the asset price. When an asset is described as highly volatile, it means its price can experience significant and rapid movements in either direction.
5. Liquidity
Liquidity describes how easily and quickly an asset can be bought or sold. An asset or market is considered liquid when there are enough buyers and sellers actively participating and a smooth flow of transactions.
6. Volume
Trading volume refers to the total number of shares, contracts, or units of a financial asset bought or sold during a given period. This represents the level of activity in the market for that particular asset.
7. Leverage
Leverage is a tool that makes it possible for traders to operate a larger position in the market with a smaller amount of capital. For example, if a trader has $1,000 and uses 1:10 leverage, they can control a position worth $10,000 in the market.
8. Market order
A market order is an instruction given by a trader to buy or sell a financial asset at the current market price. It’s the simplest and most straightforward order type.
9. Limit order
A limit order is an instruction to buy or sell at a specific price or better. If the market reaches the specified level, the order will be executed.
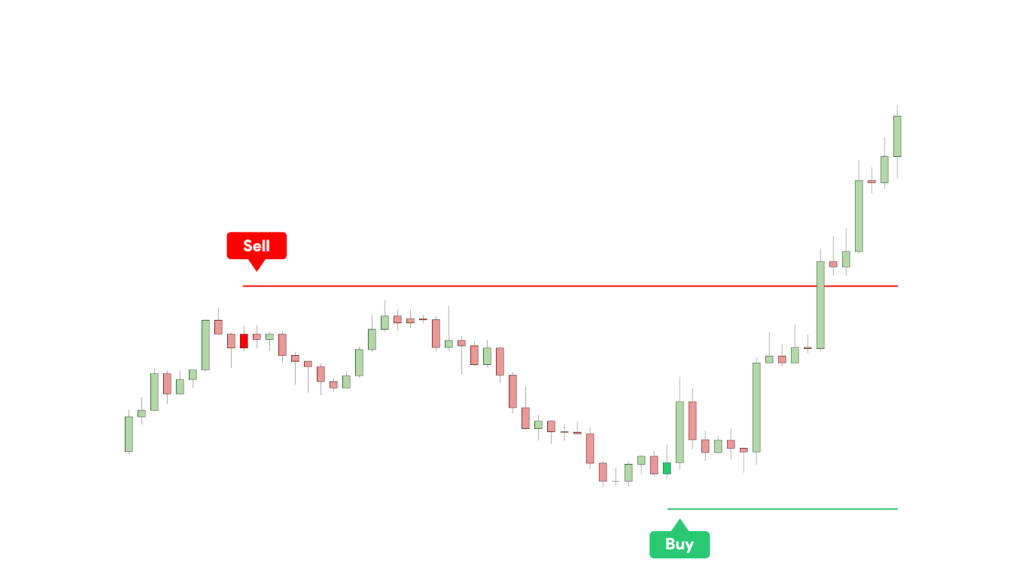
10. Support/resistance
Support and resistance are key levels at which the price of an asset is likely to stop falling (support) or rising (resistance).
Support is like a floor that prevents the price from falling further. It is a level at which there is enough buying interest in the market to counteract selling pressure and push the price back up. When the price reaches support, it tends to bounce back or stabilize.
Resistance is similar to a ceiling that prevents the price from rising higher. There is plenty of selling pressure, which counteracts buying interest. At times when the price reaches a resistance level, it often faces selling pressure (more sellers are willing to sell the asset at that price). As a result, the price tends to reverse.
11. Trendline
A trendline is a line drawn on a price chart. It connects a series of price points and helps traders visualize the overall movement of an asset’s price over a specific period.
12. Channel
A channel consists of an upper trendline and a lower trendline, and together, they create a price range or corridor where the price tends to fluctuate. It can be ascending, descending, or horizontal.
13. Indicator
An indicator is a tool used to analyze and interpret market data based on mathematical calculations or formulas. Traders often use indicators to generate trading signals or to confirm their analysis.
14. Trading strategy
A trading strategy is a set of rules that a trader follows to make decisions. It outlines the trader’s approach to entering and exiting trades based on specific criteria and market conditions.
15. Slippage
Slippage describes the difference between the expected price and the actual price at which a trade is executed. It can occur when there is a delay or discrepancy between the order placement and the order execution.
Mastering these trading terms is just the beginning. Here’s to many more terms you’ll learn in the future as you deepen your understanding and continue to grow as a trader.
Sources:
Day Trading Terminology: Top Trading Terms Every Trader Should Know! Warrior Trading
22 Phrases That Only Wall Streeters Will Understand, Insider
Earn profit in 1 minute
+2 <span>Like</span>