
When it comes to trading the foreign market, it could get very tricky and exhausting. However, by knowing how to navigate safely with the right trading strategy, you can expand your investment portfolio and gain traction as a trader.
This guide will teach you how to understand the Choch charting system and how you can deploy this knowledge in real market conditions, starting with a demo account. However tricky trading can get, you can always find your way around it with more practice.
At the end of this guide, you will learn the basics of the Choch as a trading method and how to identify opportunities in the market. Whether you are new to trading or you’re already a pro, you have all you need to start trading Choch.
The concept of the Choch charting system
Choch, as it applies to trading the foreign exchange market, means “Change of character” of the market. An example can be seen in an uptrend in the market, which is often characterized by unusual highs and highs indicative of the trend’s overall bullish behavior.
On the contrary, when a new high is formed, followed by an Impulsive downtrend, the sign points to the fact that the bullish trend may be wrapping up. This shows that the Choch transition has occurred.
Understanding the concept of the Choch charting system can help you identify potential shifts in the trend of market prices. This can allow you, as a trader, to make informed decisions free of impulsive responses. You will begin to improve your decisions when you watch out for market behaviors and how to respond accordingly.
Is Choch technical?
While the Choch charting system may look a little bit complex, especially at first glance, it becomes simple when paid much attention. The idea behind this charting system is to study the market’s character and its shifting nature over time. This is one aspect that traders must be primarily aware of as they improve their skills and expand their portfolios.
Let’s look at some graphical examples of the Choch charting system and how to read its meaning to it.
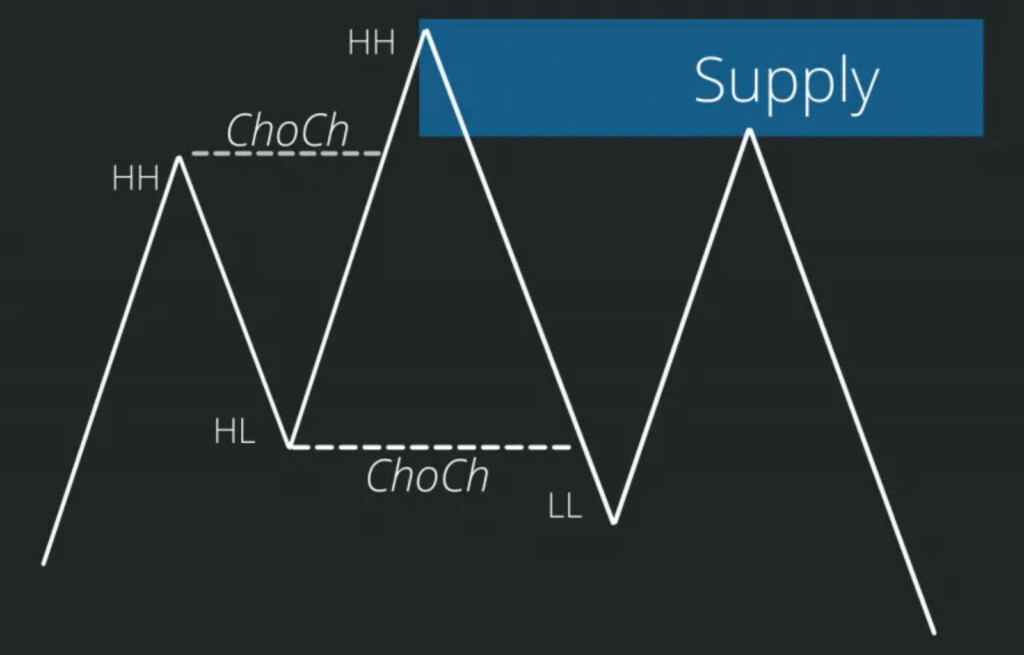
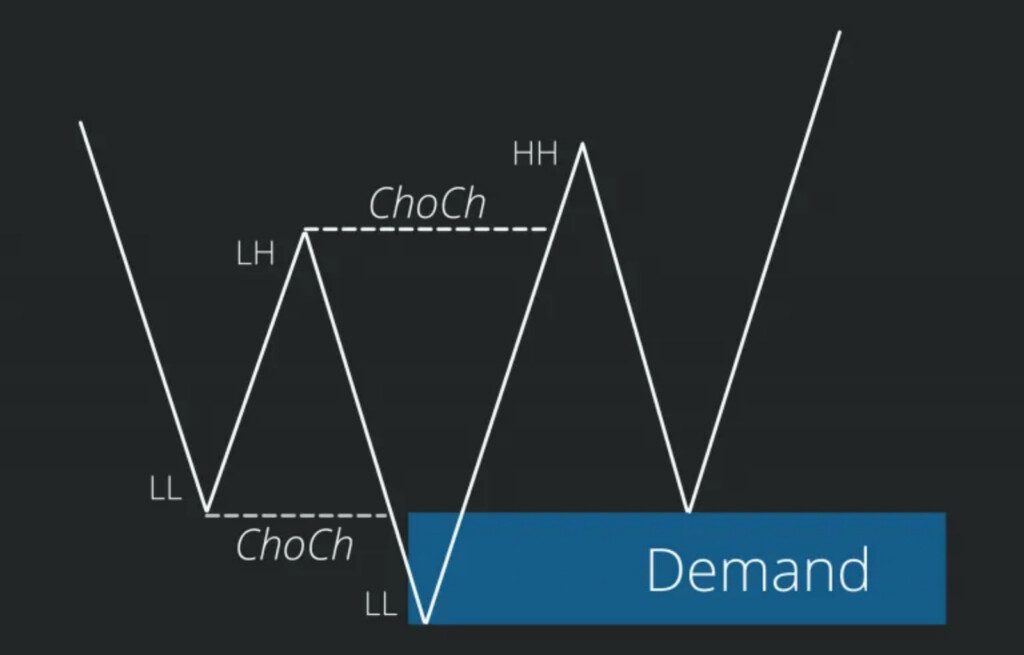
In the below charts, there is a bearish trend which creates HH. The HL is defined to create a supply zone. The second chart with the bullish trend shows the opposite outcome of the bearish trend.
1. Supply zone analytics


2. Demand zone analytics

One thing you will notice on both charts is that the last HH or LL is formed before there is a significant change in the character of the market. The break in the structure of the initial bullish or bearish trend can be marked as Choch. The break in structure is important because it can signal a major shift in the market, providing a great opportunity for traders to realize a profit. It is thus important that the Choch charting system is used to complement other trading methods.
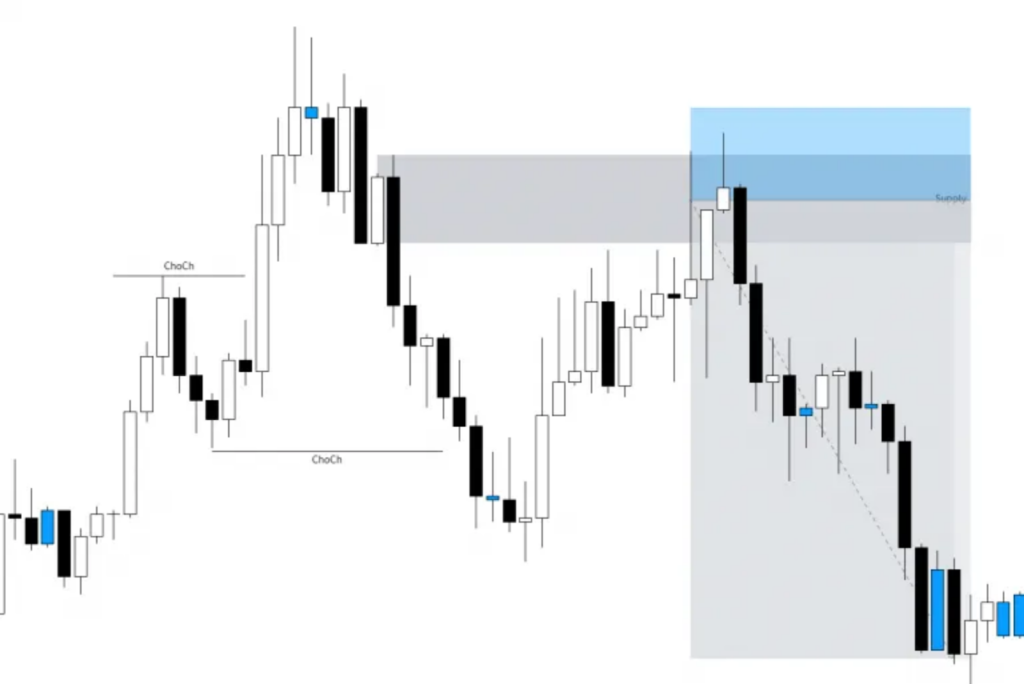
3. Supply and demand zones cross intersections
To consolidate the scenario above, we will take it a bit further by looking at a live example (Cross intersection)

In the live example, the change in the character of the market is identified at different levels to indicate the end of a trend and the beginning of a contrary one.
One important thing to note is that successful traders remain at the top based on their ability to spot major market conditions correctly.
Finally…
Trading the global market can be a complex Forex trading can be a complex and demanding task for traders who are new to the system. The market looks less like the crisp and clear charts and diagrams that illustrate it, which makes real-life identification daunting. Amidst the confusion that abounds with trading on a real account with the Choch charting system, it is imperative to start with good practice.
Source:
—How to trade Choch, SMT FX
—Bloomberg analysis on demand and supply, Bloomberg professional Services


