
Chart patterns come in all shapes and sizes. There is an Elephant with its trunk raised, Dead Cat Bounce (named after the idea that even a dead cat will bounce if it falls from a great enough height), and Quasimodo, named after Quasimodo, a fictional character of ‘The Hunchback of Notre-Dame’. But these aren’t particularly popular.
In general, chart patterns are an essential part of technical analysis, and they are particularly valuable for traders who focus on short-term trading, such as scalpers. While there are many to choose from, some patterns have proven to be more reliable and effective than others. So, let’s take a closer look at the best chart patterns.
Start from $10, earn to $1000
What is scalping?
Scalping is a trading strategy that aims to profit from small price movements in financial markets. Traders who use this strategy are known as scalpers. And their goal is to take advantage of short-term price volatility by buying and selling assets very quickly.
Scalpers typically trade in highly liquid markets (for example, forex, crypto, or stocks) and make multiple trades throughout the day. They’re mostly focused on many small profits, which should add up over time. This comes in contrast to traders who hold positions for a longer period.

Scalping requires a high level of skill and experience because traders must be able to analyze market conditions, identify patterns, and make split-second decisions. Scalpers use a variety of technical analysis tools (including chart pattern trading) to identify potential trade opportunities and set entry and exit points. The time difference between entering and exiting positions may be in minutes or even seconds.
Effective strategies in your mailbox
Subscribe and discover a fund of trading knowledge
Great! Please check your email
We’ve sent you an email to confirm your subscription
Something went wrong
Try reloading the page. If that doesn’t help, please try again later
Characteristics of a scalper trader
To become a successful trader, you must inhibit a particular set of skills and personality traits, such as:
- Quick decision-making skills – This strategy is all about making lightning-fast decisions on when to enter and exit trades. And for this, traders must have excellent analytical skills.
- Discipline – Scalpers must be able to control their impulses and stick to their trading plan, avoiding the temptation to make rash decisions that could lead to losses. Waiting for the perfect moment to strike takes a lot of patience.
- Risk management – With more trades and smaller profits than other traders, scalpers must be masters of risk management. They should be able to balance risk and reward with precision and skill.
- Focus and concentration – It’s crucial to tune out distractions and stay focused on the market at all times.
- Adaptability – Scalpers are like skilled athletes, able to react quickly to changing market conditions and adjust their strategy as needed.
What are chart patterns, and why are they important for scalping?
Chart patterns are visual representations of price data that traders use to identify trends, reversals, and other price movements. They are an important aspect of technical analysis and take many different forms, including triangles, wedges, and rectangles, among others. Each pattern represents a unique price movement and provides valuable information about market conditions.
Trading with up to 90% profit
For scalping, chart patterns are particularly important. They provide scalpers with a crucial advantage in a fast-moving market, giving them the insight they need to act decisively. For example, a scalper may use a pattern to spot a potential market reversal and decide to close their position to lock in profits.
Chart patterns are also a valuable tool for managing risk and optimizing trading strategies. You can use them to identify key support and resistance levels, place stop-loss orders, and set profit targets.
And without further ado, here are the top chart patterns that every scalper should know:
Top 5 sitting postures for traders
Many traders think less about their sitting postures, negatively impacting their health. Check it out!
Read more

1. Bullish flag and bearish flag
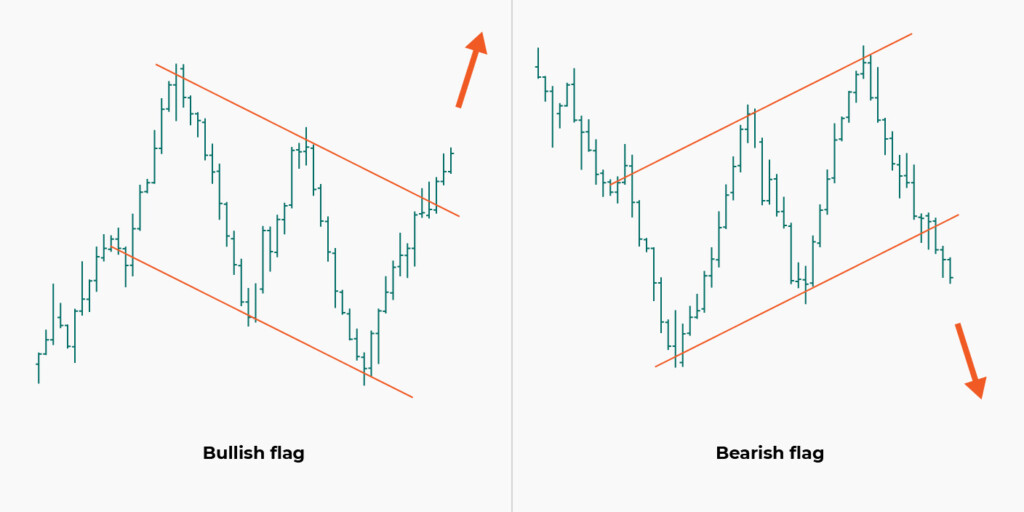
The bull flag and bear flag patterns get their name from the way they look on a chart, resembling a flag on a pole. Both patterns suggest the accumulation of market participants in opposing directions to the general trend. It’s called consolidation as the market needs time to evaluate the factors that can drive the price in the direction of the general trend.
In a bull flag pattern, scalpers observe an initial strong upward movement, followed by a consolidation period forming a flag shape. If sellers manage to take control of the market, the trend will reverse. But if buyers accumulate their strength, a strong bullish sentiment will be formed. The bull flag says the price is likely to rise after the price breaks above the upper flag line, so traders usually open a long position after an upward breakout occurs

A bear flag pattern is characterized by a sharp downward movement, which is then followed by a consolidation period. It suggests that buyers want to take control of the market. And if they fail, the downside is likely to open up for another sell leg after the price breaks below the lower flag line. Overall, the pattern indicates that the price is likely to continue to decline as sellers continue to add to their positions. In the case of a bear flag, traders usually go short when the price falls below the lower line of the flag.
2. Ascending, descending, symmetrical triangle
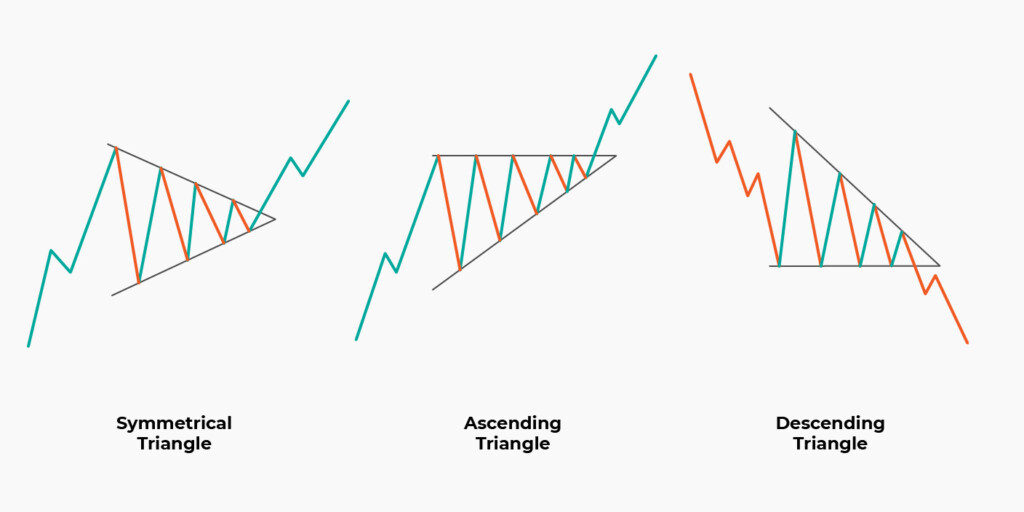
This one is generally considered a continuation pattern. But each type of triangle pattern (ascending, descending, and symmetrical) has its own unique characteristics and interpretation for scalpers.
Ascending triangle
An ascending triangle pattern consists of a horizontal resistance line and a support line that slopes upwards. This pattern is a bullish signal that indicates an asset’s price is likely to climb higher. This pattern is formed by two trendlines, where the top trendline acts as resistance and the bottom trendline shows price support. Traders can enter a long position when the price successfully breaks above the resistance line, which indicates the resumption or beginning of an uptrend.
Descending triangle
A descending triangle pattern consists of a horizontal support line and a resistance line that slopes downwards, and it’s the opposite pattern. When the price breaks below the support line, it confirms the bearish pattern, which indicates that the price may continue to decrease. In that case, you can enter a short position.
Symmetrical triangle
This one’s formed by two trendlines that converge toward each other. The pattern is called symmetrical because the trendlines have equal slopes, telling you that buyers and sellers are evenly matched.
Symmetrical triangles typically indicate either the continuation of the existing trend or a trend reversal, depending on the direction of the breakout (in the direction of the existing trend = continue, in the opposite direction = reversal). When the price breaks out of the triangle in either direction, it generates momentum that can propel the market price a significant distance.
3. Cup and handle and inverse cup and handle
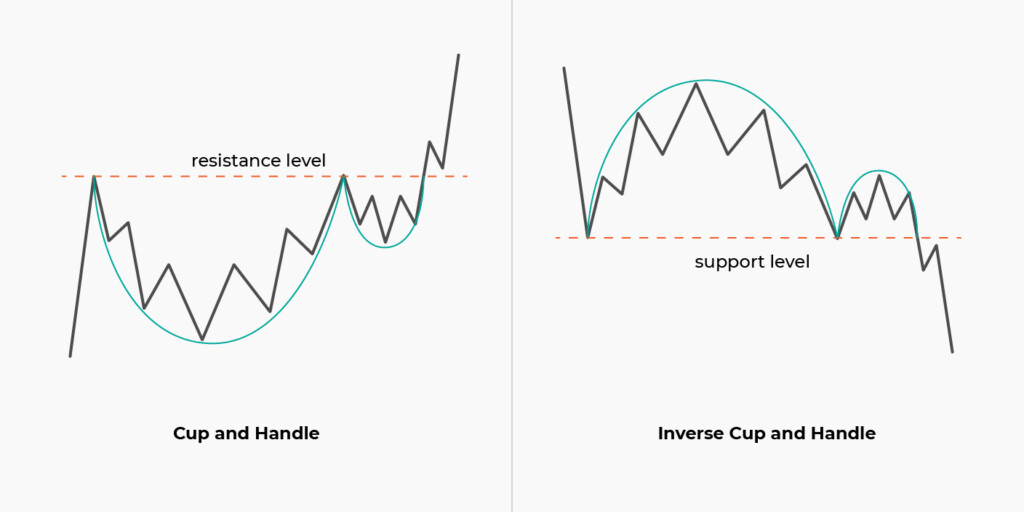
With a cup and handle, the cup part forms when the asset’s price declines sharply. Then it’s continued by a period of stabilization, which forms the bottom of the cup. The price later rises to the rim of the cup, which is typically equal to or slightly less than the cup’s high point. The price then moves sideways or declines slightly ( = the handle), characterized by a small price range.

The inverse cup and handle is a mirror image of the classic cup and handle pattern. The pattern appears when an asset’s price rises to a new high, followed by a decline that creates an upside-down U-shaped pattern.
One way to use the cup and handle pattern in scalping is to wait for the price to break above the resistance level or the handle. This can signal a bullish continuation and provide a buying opportunity for those looking to capitalize on the momentum. Similarly, you can use the inverse cup and handle pattern by waiting for the price to break below the neckline support level or the handle. The downward breakout points to a continuation of a bearish trend.
4. Head and shoulders and inverse head and shoulders
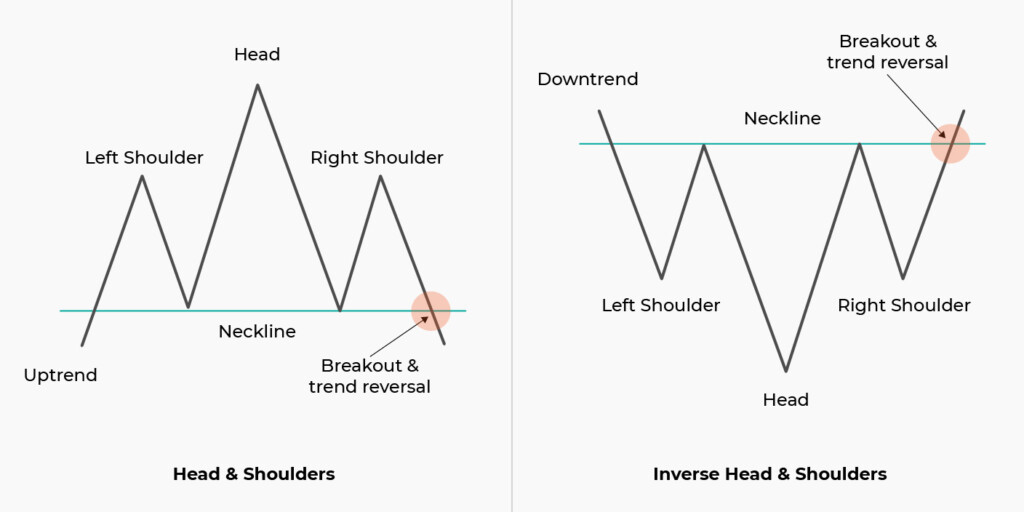
Head and shoulders is characterized by three peaks, where the outside two are close in height, and the middle is the highest. The pattern occurs when the price rises to a peak and then declines back to the base of the prior up-move. After that, the price rises above the previous peak to form the head and declines back to the original base. Finally, the asset price peaks again at about the level of the first peak of the formation before falling back down.
The pattern suggests that the current upward trend is losing momentum, and a new downward trend could be starting. And scalpers should consider entering short positions or closing their long positions after the price breaks below the neckline, a support level drawn through troughs between three peaks.
The inverse head and shoulders pattern is the opposite and is also known as a head and shoulders bottom. It’s used to predict potential reversals in downtrends. The pattern is identified when the price of an asset falls to a trough, rises, falls below the former trough to a lower point, rises again, falls again, and then bounces up. Traders can consider entering a long position or closing short positions after the price breaks above the neckline, a resistance level drawn through peaks between troughs.
5. Double top and double bottom
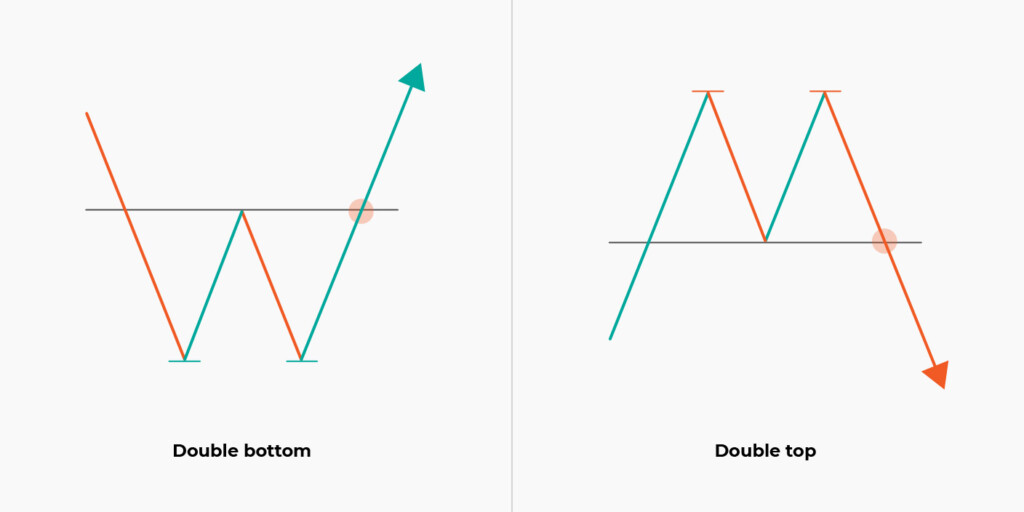

You can see a double top when the price reaches a high point, retreats, and then reaches a similar high point before reversing direction and moving downwards. The neckline (the low between the two peaks) serves as a crucial level that scalpers keep a close eye on. If the price falls below the neckline, it’s probable that the bearish momentum has gained enough strength to break through the support level, and it’s the right time to sell or short the asset.
A double bottom is a bullish reversal pattern. It’s formed when the price of an asset reaches a low point, rebounds, and then drops to the same level as the previous low before reversing the trend and moving upwards. The two low points are considered the bottoms of the pattern, and a high between the bottoms create a neckline. Traders could use the neckline of the pattern as a crucial resistance level. If the price breaks above the neckline, it can be an indication to go long on the asset.
Concluding thoughts
In conclusion, mastering chart patterns is a crucial step for scalping traders. If you’re new to this, focus on a select few and go from there.
And one last thing: remember that even the most profitable chart patterns aren’t infallible. You should always use other technical indicators, fundamental analysis, and risk management strategies to confirm your trading decisions.
Sources:
Bull Flag vs Bear Flag and How to Trade Them Properly, The5ers
Triangle Patterns – Technical Analysis, Corporate Finance Institute
Cup and Handle Pattern: How to Trade and Target with an Example, Investopedia
How to Trade the Head and Shoulders Pattern in Forex, BabyPips
How to Trade Double Tops and Double Bottoms in Forex, BabyPips
Earn profit in 1 minute
+1 <span>Like</span>