Many might be surprised to learn, however, that since about 1800, stocks have consistently returned an average of 6.5 to 7.0 percent per year (after inflation). McKinsey’s analysis shows that market returns in the past 25 years are within that historical range.
See? There are a lot of opportunities when you leverage historical data in your trading endeavors. However, let’s not focus solely on potential investment returns. There are many other insights you can derive from historical data, including pattern recognition, backtesting, seasonality, market sentiment analysis, and correlation analysis.
Important note: While historical data can provide valuable insights and opportunities, it’s important to recognize that past performance is not a guarantee of future results. It should be used in combination with other forms of analysis and risk management techniques.
Earn profit in 1 minute
Pattern recognition

Historical data allows traders to study the behavior of price movements and identify patterns that have repeated over time. These patterns can manifest in various ways, such as trend continuation patterns (e.g., flags, pennants), reversal patterns (e.g., head and shoulders, double tops/bottoms), or candlestick patterns (e.g., doji, engulfing patterns). Each pattern carries its own implications and can provide signals about potential future market movements.

Moreover, the combination of pattern recognition with other technical indicators will further enhance your strategies. Try incorporating other tools like moving averages, oscillators, or volume analysis to validate patterns and gain additional confirmation.
Effective strategies in your mailbox
Subscribe and discover a fund of trading knowledge
Great! Please check your email
We’ve sent you an email to confirm your subscription
Something went wrong
Try reloading the page. If that doesn’t help, please try again later
Backtesting strategies
Historical data allows traders to recreate trading scenarios and test their strategies across different market conditions and timeframes. They can apply specific entry and exit rules, position sizing techniques, and risk management parameters to historical data and observe how their approach would have performed in the past.
Don’t forget about performance metrics like total return, maximum drawdown, and risk-adjusted returns. These data points will reveal if you need to make some adjustments to your strategy:
For example, you observe that your trading strategy performs exceptionally well during trending market conditions, generating significant total returns. However, you notice that the strategy’s performance deteriorates during periods of low volatility or choppy markets. So, you’ll want to incorporate additional filters specifically designed to identify ranging markets and avoid entering positions then.
Seasonal trading opportunities
Seasonal trading opportunities can manifest in various forms, such as:
Trading with up to 90% profit
- Specific calendar months or quarters exhibiting consistent price movements or trends
- Market phenomena associated with holidays or events, where market participants exhibit certain behaviors
- Periods characterized by higher or lower volatility, liquidity, or trading volumes
The point is to observe how different factors historically impact asset prices and market conditions during specific times of the year.
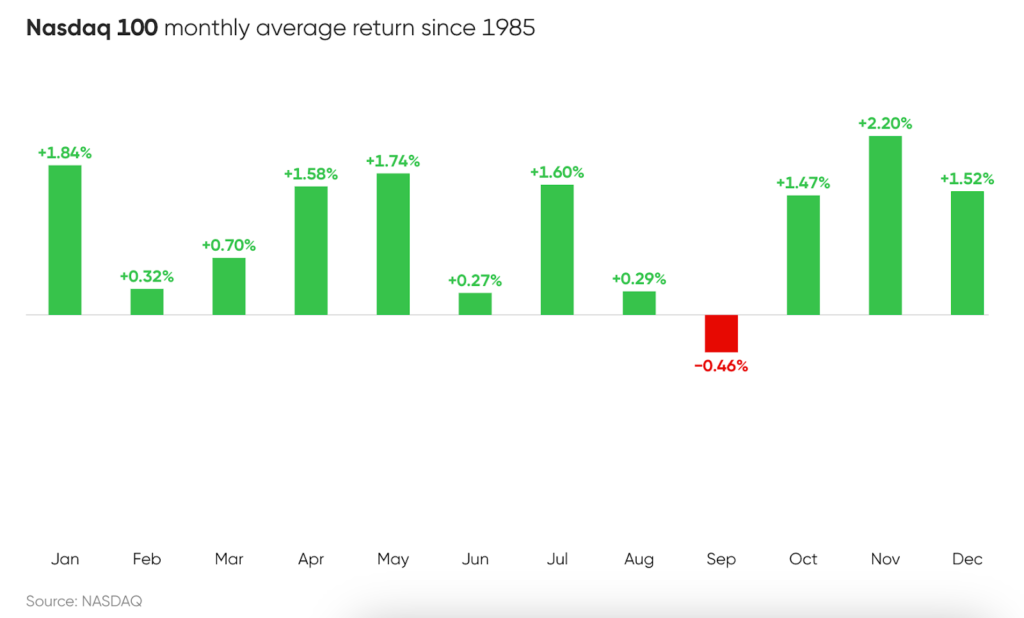
There are different phenomena observed throughout the year, including the January Effect, Sell in May and Go Away, the Summer Doldrums, the Halloween Effect, and the Santa Claus Rally. Furthermore, September has been associated with market volatility and negative results in the stock market, so traders should be mindful of this historical tendency.
Top 5 sitting postures for traders
Many traders think less about their sitting postures, negatively impacting their health. Check it out!
Read more

Market sentiment analysis
Here’s a look at market sentiment analysis through the lens of historical data:
- Understanding investor sentiment — Investor surveys, put-call ratios, or sentiment indexes can show shifts in sentiment and potential market turning points.
- Contrarian trading — Historical data can reveal situations where the majority of market participants are overly optimistic or pessimistic. During excessive bullishness, a contrarian trader will then take a bearish stance, anticipating a reversal in market sentiment.
- Market psychology and behavioral finance — You can identify common biases, such as herding behavior or irrational exuberance.
- Event-driven trading — By examining past reactions to specific events, traders can anticipate potential market sentiment shifts in response to similar events in the future.
- News and social media analysis — There might be historical relationships between news releases, social media sentiment, and price action. If so, why not leverage it?
Asset correlation analysis
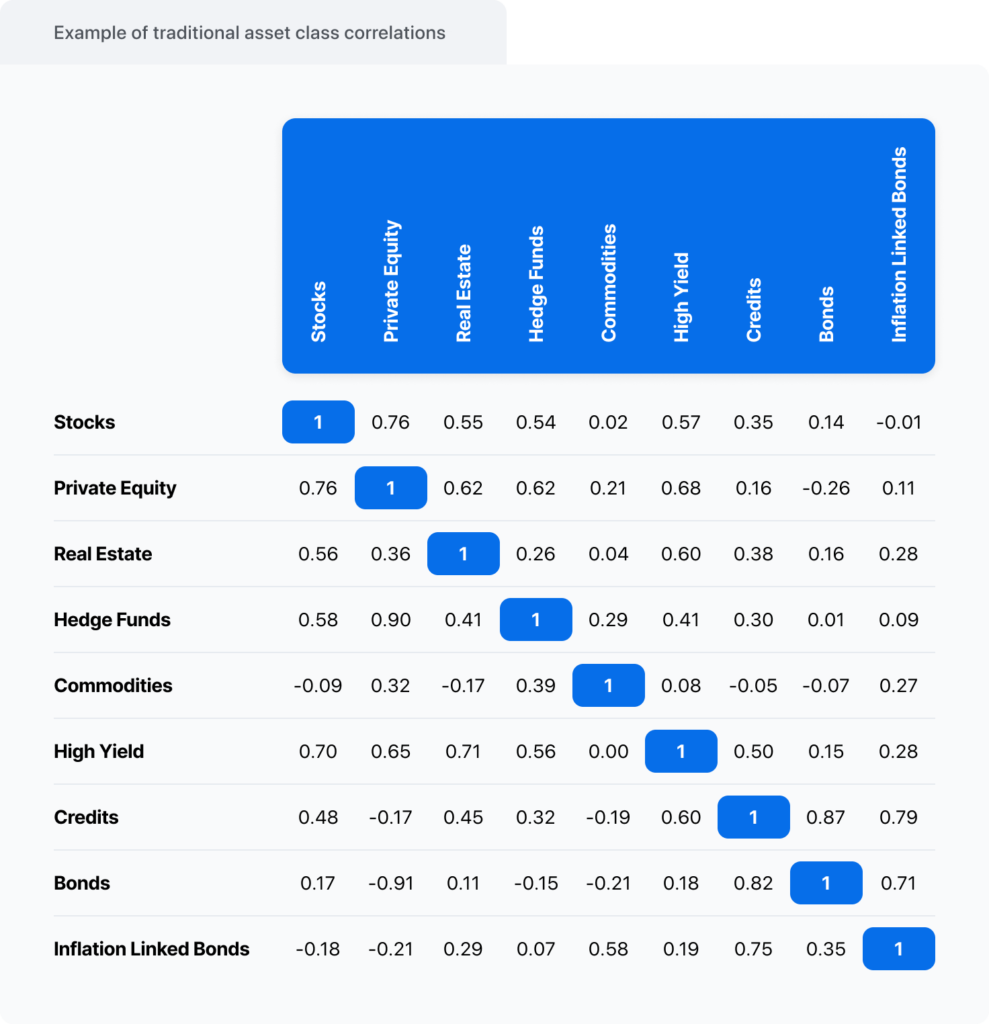
This technique involves analyzing past data to determine how closely or inversely two or more assets have moved in relation to each other. It’s measured on a scale from -1 to 1, with 1 representing a perfect positive correlation, -1 — a negative correlation, and 0 indicating no relationship between the assets. For example, stocks have a lower correlation with commodities (0.02) but a higher correlation with private equity (0.76).
How is that helpful in trading? Well, this information allows you to break up your risk across different asset classes, adjust your portfolio allocation, and explore strategies that take advantage of this relationship.
Sources:
Markets will be markets: An analysis of long-term returns from the S&P 500, McKinsey
Seasonality trading strategies, TrendSpider
Correlation: trading, diversification, and recent developments, BSIC
Start from $10, earn to $1000
<span>Like</span>