
From the valuable list of Chaikin’s inventory, we will be exploring one of his breakthrough inventions. The Chaikin oscillator has always been a productive indicator for traders to maximize their trading profit. Although this indicator is not popularly used, it helps to predict the future price movement of an asset. Much like any other trading indicator, the Chaikin oscillator particularly specializes in the identification of definite turning points in the price of an asset or stock.
Because of the similarity in function with the Chaikin volatility indicator, traders sometimes mistake it for the volatility indicator.
Volume analysis helps in identifying internal strengths and weaknesses that exist under the cover of price action
— Marc Chaikin, SNR Oscillator Expert
What is a Chaikin oscillator?
As earlier established, the Chaikin oscillator is a handy tool for investors to be aware of the future price of an asset. This is achieved by studying the momentum in asset volume flow, and by measuring the distribution/accumulation line of the moving average convergence divergence (MACD). This makes the Chaikin oscillator an indicator of indicators, productively granting traders and large-scale investors the benefit of using two technical analysis tools.
The birth of the Chaikin oscillator
For many years, traders have largely accepted the school of thought that volume and price will rise and fall simultaneously. However, price action usually lags a notable change in the momentum of the trading volume, thus identifying the point of significant volume change has become a valuable tool for investors.
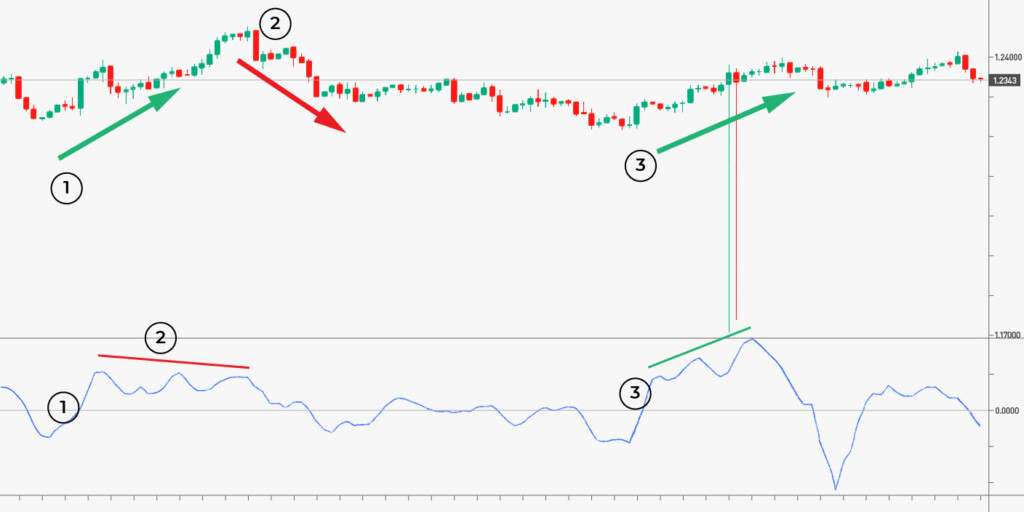
This has necessitated the need for a productive trading indicator called the Chaikin oscillator. The function of the Chaikin oscillator is measured by taking the difference between the 3-day and 10-day EMA of the moving average convergence divergence’s (MACD) accumulation/distribution line.
5 positive ways the Chaikin indicator affect your trade
The Chaikin oscillator can be used by traders in many productive ways. Some of which can either be to understand the behavior of an asset, or to get insight into the potential of an asset in the future. Below are five productive ways the Chaikin oscillator can affect your trade.

1. Case 1.0
Traders can use the Chaikin oscillator productively as a great source of guidance as to when to open or close a position. When the Chaikin oscillator falls below zero (0), there is no trading activity going on in the market. This is usually a good time for investors to refrain from taking any decision, and wait patiently for the indicator to indicate when there is market activity. This is a nice way to prevent overtrading.
2. Case 2.0
As a growing trader of the foreign exchange market, accurate determination of trading volume is essential. Since price rallies are usually fueled by trading volume, you will need to understand how volumes come about in your trading. The Chaikin oscillator is a good way to monitor how trading volume flows in and out of the market. By comparing this volume flow with price action, you can effortlessly identify the bottoms and tops of an asset price, for both intermediate-term and short-term trade.
3. Case 3.0
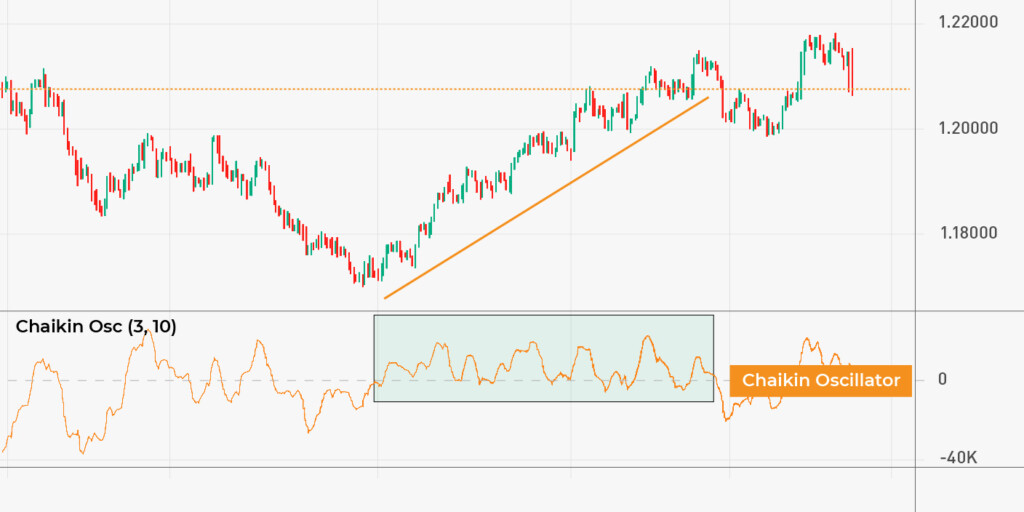
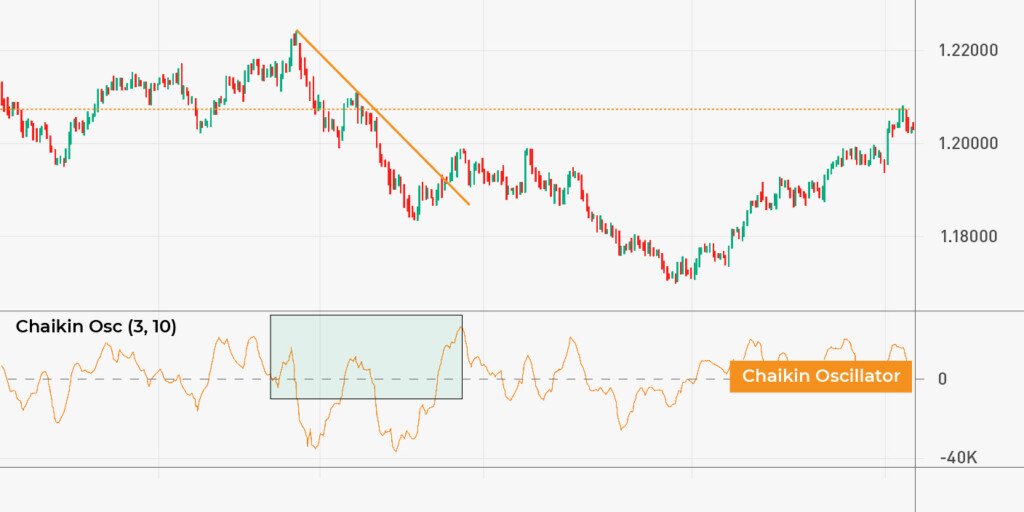
The Chaikin oscillator is a powerful tool for productive trading. It can be used in trend following to complement several other technical indicators such as the moving average (MA) or the relative strength index (RSI), and Bollinger bands. In this case, when the price of an asset is rising, the Chaikin oscillator will also rise above the zero (0) line. If the Chaikin oscillator goes above the neutral line, the price of the asset will continue to rally, and vice versa.
4. Case 4.0
Most importantly, the Chaikin oscillator is an invaluable indicator that spots divergence. A divergence is a market situation where the price of an asset starts to move in the opposite direction as the indicator. Most oscillators like the RSI and MACD are often used to show market divergence. Knowing how to wield the Chaikin oscillator is a productive way to gain an advantage over the market. A relative example of how to note divergence is if an asset’s price is rising while the Chaikin oscillator is falling, a pullback is likely to happen.
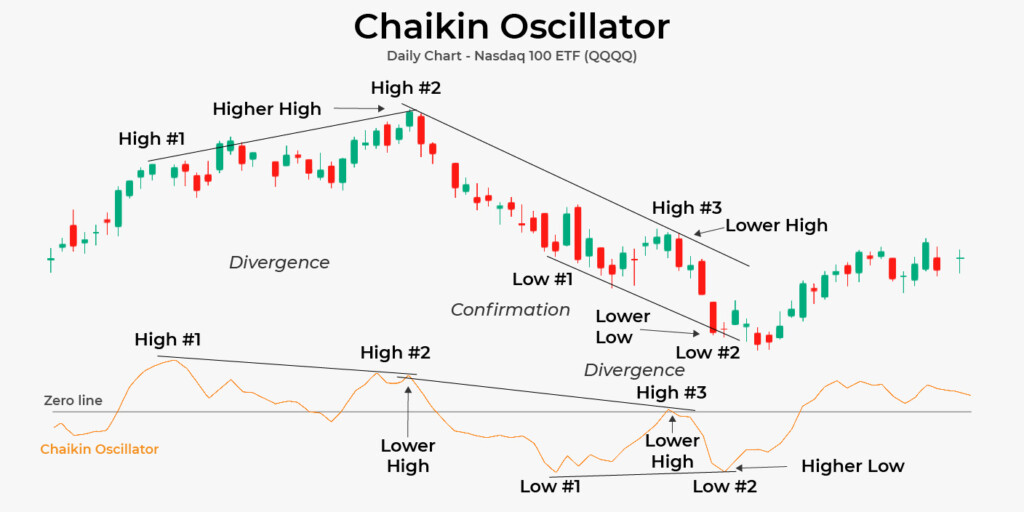
5. Case 5.0
The usefulness of the Chaikin oscillator is in determining a bearish or bullish trend in the market. Instead of trying to wrap your head around a complex way to know if the market is in your favor, you can now use this indicator to solve that. Whenever the Chaikin oscillator is positive, it is indicating a bullish trend while a bearish trend is imminent when there is a negative Chaikin oscillator.
Productive tips for using the Chaikin oscillator
There are two major tips for productively using the Chaikin oscillator:
Firstly, you must ensure that the price of the asset is not in consolidation mode. If this happens, the Chaikin oscillator will not work productively.
Secondly, ensure that you properly check the data that constitute the Chaikin oscillator. Depending on the platform, the slow length of the indicator is usually 10 while the fast length is 3. This can be changed based on your trading strategy. Also, the default color can be changed to match your trading preference.
Conclusion
The Chaikin oscillator is an indicator that is rarely utilized by traders. However, it is one of the few effective indicators out there. We have looked into how you can make productive use of this indicator and what to ensure when using it. To become productive with the Chaikin oscillator you still need to spend quality time practicing regularly.
Sources:
Quantified Strategies: Chaikin Oscillator Trading Strategy – Does It Work?
Investopedia: Chaikin Oscillator: Definition, Calculation Formula, Example
BabyPips: Chaikin oscillator
Capital.com: Trading using the Chaikin oscillator
DAY TRADE THE WORLD: DAY TRADING WITH CHAIKIN OSCILLATOR: CALCULATION & STRATEGIES


