
To trade successfully, the first thing you should learn is how to identify trends. A trend provides numerous trading opportunities, so learning to identify it on a price chart is vital.
A trend is an overall market direction for a certain period. The period depends on the timeframe you trade on. There are three trend types: uptrend, downtrend, and sideways. Interestingly, those who buy and push the price are called bulls, while those who sell and pull the price are called bears. These terms originated in the early 18th century.
Although you can identify a trend by eye, there are several tools that will help you do it more accurately. Keep reading to discover how to identify the trend on charts at low speed.
Start from $10, earn to $1000
1. Highs and lows
The first sign of a trend is sequential highs and lows. When a price forms lower highs and lower lows, it’s a downtrend. When a price sets higher highs and higher lows, it’s an uptrend. When a price moves horizontally so that highs and lows are almost at the same level, it’s a sideways trend.
Effective strategies in your mailbox
Subscribe and discover a fund of trading knowledge
Great! Please check your email
We’ve sent you an email to confirm your subscription
Something went wrong
Try reloading the page. If that doesn’t help, please try again later
2. Trendlines
To make it easier to identify a trend, you also can connect highs and lows so that the trend is framed. The lines connecting peaks and lows are called trendlines. They are automatically implemented in any trading platform. On the chart below, two trendlines frame a downtrend.
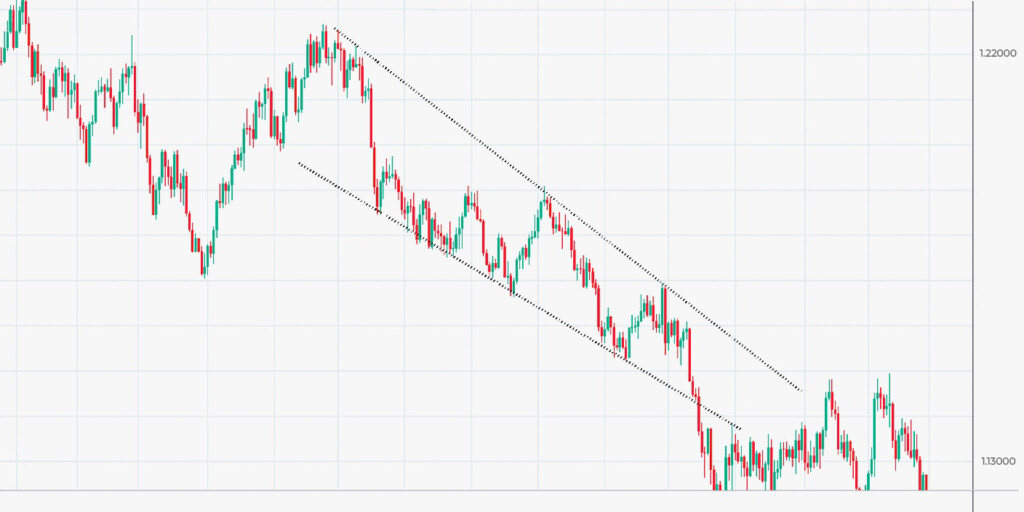

Note: there should be at least two points to draw a trendline. A trendline breakout is used as a signal of a trend reversal.
3. Timeframe
How to find the trend of a graph? Every trend has a specific period which depends on the timeframe. For instance, a trend lasts for several hours on a minute timeframe, several days on an hourly timeframe, and months and even several years on daily charts. A timeframe helps traders understand whether it’s a real trend or a short-term retracement.
Earn profit in 1 minute
For instance, if you see 10-day candlesticks, it’s not a trend. However, if you see 10-minute candlesticks, it’s a trend.
How to start trading with $200 and minimum risk
Don’t let a small budget deter you from trading! Learn how to start trading with $100 or $200 and make the most out of this money!
Read more

4. Moving average
Another way to identify a trend is to use trend indicators. The list isn’t limited to a moving average (MA), ADX, and parabolic SAR. There are other tools you can implement to frame a price direction.
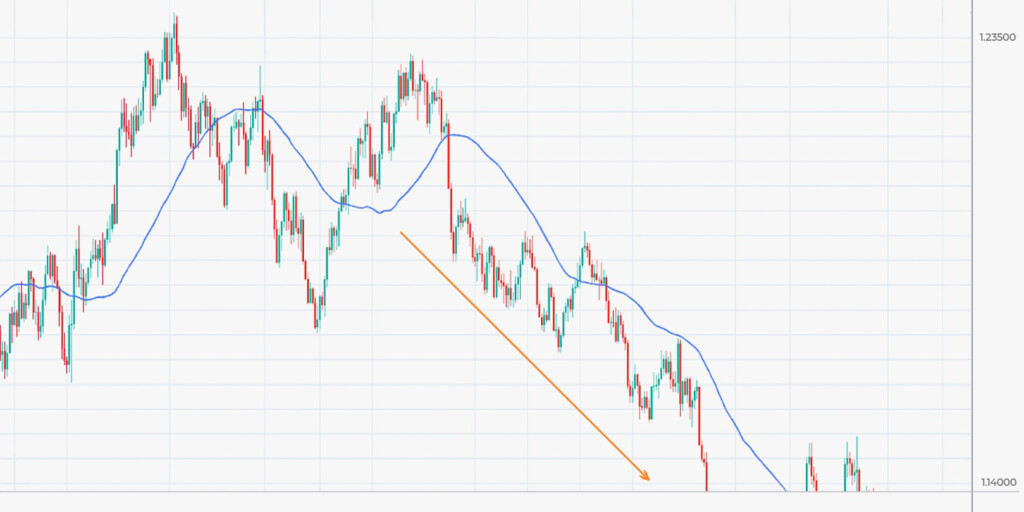
A simple moving average is a lagging indicator, so it provides a reliable sign of a trend formation. The rule is simple: when candlesticks are above the MA, it’s an uptrend. When candlesticks are below the MA, it’s a downtrend. If the MA moves sideways, it’s a sideways trend.
As soon as the MA changes its location regarding candlesticks, it’s a sign of a trend reversal.
5. ADX
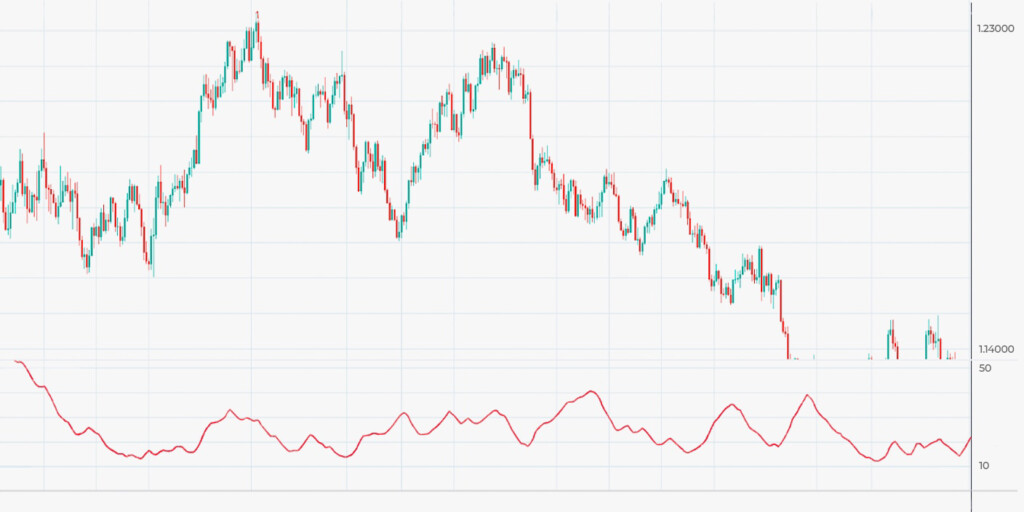
An ADX indicator itself doesn’t reflect a market direction. However, it helps traders determine how strong the trend is. The ADX line moves within the 0-100 range.
- 0-25. If the indicator moves within the 0-25 range, there is no trend.
- 25-50. When the indicator moves to the 25-50 range, the trend is strong.
- 50-75. If the trend is very strong, the indicator moves within the 50-75 range.
- 75-100. If the trend is extremely strong, the indicator rises to the 75-100 range.
6. Parabolic SAR
It’s a simple indicator that reflects when the trend is up and down. However, it doesn’t work when the price moves sideways.
How to identify the trend on charts with parabolic SAR? Simple. If there are at least three dots above candlesticks, it’s a downtrend. If there are at least three dots below candlesticks, it’s an uptrend.
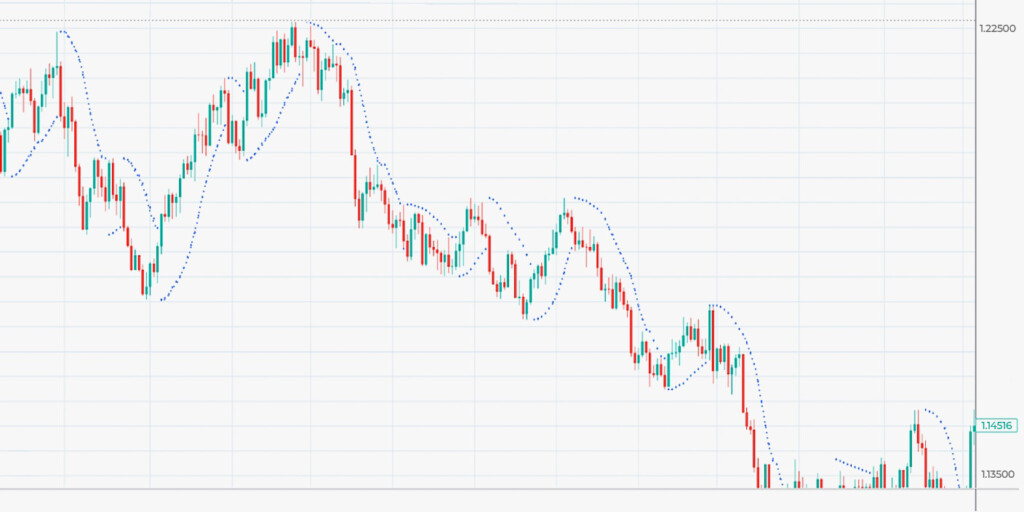
Note: the indicator also reacts to retracements. Therefore, you should combine it with other tools to determine the overall trend.
7. Patterns
There are reversal and continuation chart patterns. If you have identified the current trend, patterns will allow you to understand whether it will continue or reverse.
The most popular continuation patterns are flags, wedges, pennants, and rectangles. Also, traders often use such reversal patterns as head and shoulders and inverse head and shoulders, double top/bottom, and triple top/bottom.
Patterns allow for determining the trend, and they have specific rules on how to enter and exit the market.
How to identify the trend of a graph?
It’s easy to identify a trend. You can do it by eye. However, you can implement different tools, including chart patterns and trend indicators, to ensure it’s still valid and strong. Always frame trends as trendlines also work as support and resistance levels. This will help you set additional trades.
Trading with up to 90% profit
+1 <span>Like</span>