

Fundamentally, when we talk about the Coppock Oscillator Bar, we have to recourse to the Coppock Curve. It is the basis on which we try to derive the best point on the momentum and price movements to make principal market and trading decisions. Moreover, it is one of the most accommodating and flexible ways traders can predict their future market behavior.
The Coppock curve designed by Edwin Coppock has evolved into one of the most technical analysis tools for traders in the market. It uses simple and basic analytical terms to predicate the long-term and, possibly, the short-term market.
The Coppock curve derives its mathematical verification from monthly installments of progressive market trends and price movements. Also, it calculates the momentum of the particular underlying assets and securities or ETFs to understand their long-term viability and values.
Start from $10, earn to $1000
The Coppock curve
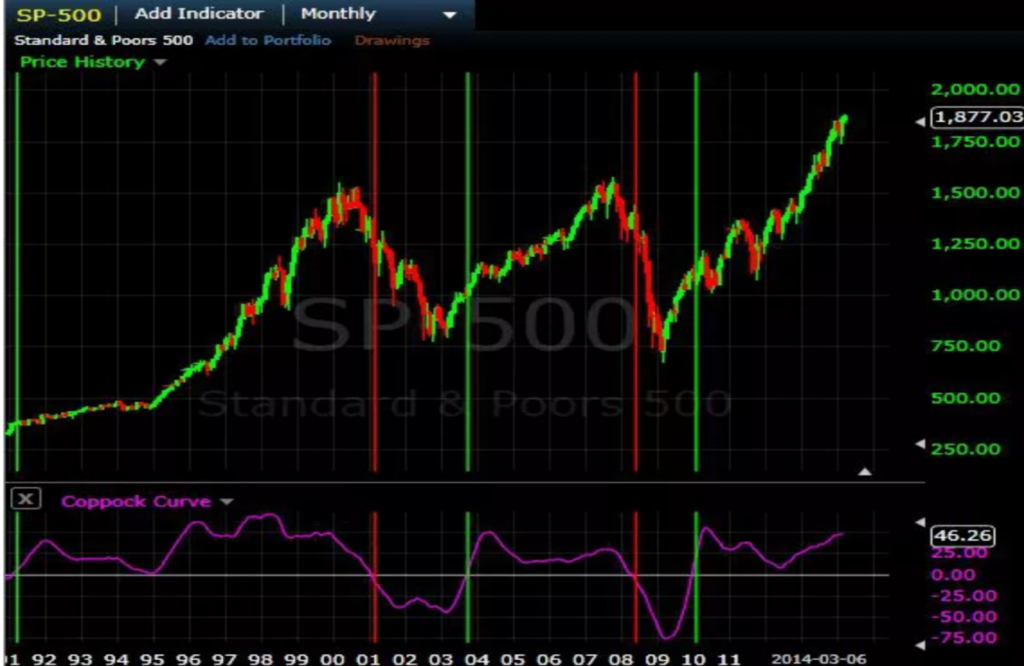
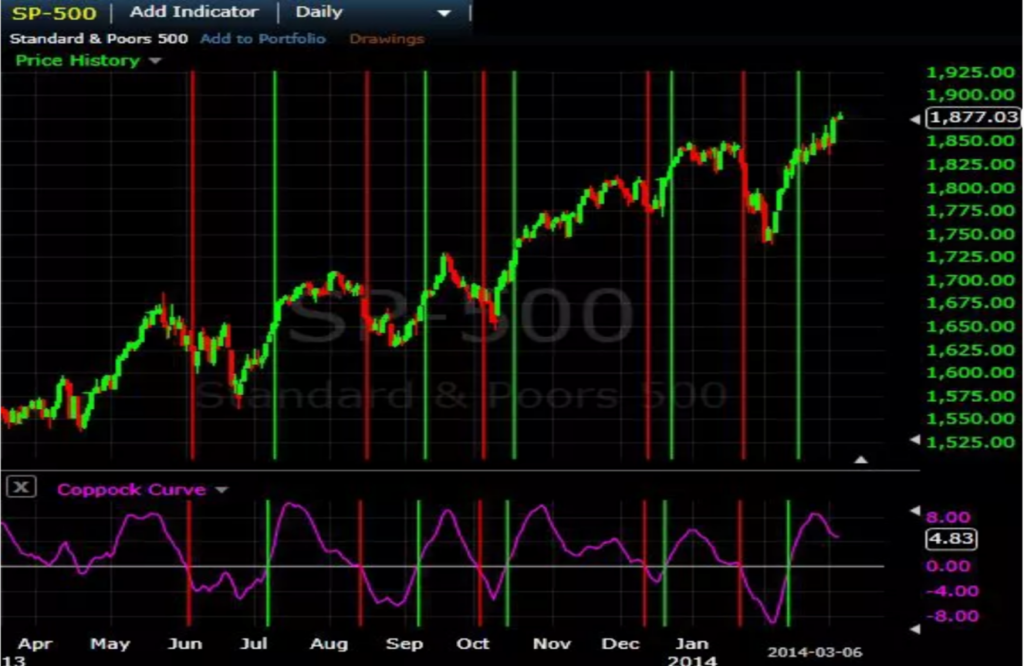
Coppock curves are price momentum indicators used in the long term to determine upturns and downturns in the stock market. It is a 10-month weighted moving average (WMA) between the 11-month and 14-month rates of change (ROC). Many investors also called it the “Coppock guide.”
The formula for this curve was put together in 1962 by Edwin Coppock, who gave it its name. You are supposed to use it on monthly candlestick charts, where every candle suggests one month. If the reading is above zero, it signals a buy. However, if it drops below zero, then it signals it’s time to sell.
Effective strategies in your mailbox
Subscribe and discover a fund of trading knowledge
Great! Please check your email
We’ve sent you an email to confirm your subscription
Something went wrong
Try reloading the page. If that doesn’t help, please try again later
Adjusting settings

The typical settings of the indicator will work very well for you when used monthly. However, if you are going for a shorter timeframe, it may not work as well. This can cause exits and entries to happen later than they should. As a result, you may not be able to make as much profit.
If you decrease the ROC variables, you will increase the fluctuation speed of the Coppock Curve, therefore increasing the number of trade signals. On the other hand, if you increase the ROC variable, it will slow down the fluctuations, producing fewer signals.
To fit your strategy, you may adjust the settings in the manner that you see fit. If you want to get your entry and exit faster, then you’ll want to decrease your WMA. This way, you’ll get more trade signals. That being said, if you want to wait for confirmation, you can increase your WMA instead. This will decrease the trade signal number instead.
Filtering trades
If you are an active trader, you may want to trade signals following one direction: the one with the dominant trend. That’s where you will find most of the profits. This applies whether you are a beginner trader or if you have been in the profession for a long time.
Earn profit in 1 minute
Check out a long-term chart and take notes of the current trading direction. If the trading occurs on a daily timeframe, then you’ll want to look at the weekly trades. If you notice that the Coppock Curve is above zero on the weekly chart, then you may want to focus on long trades for your day trading strategy.
When you see the signal, you may make the sale. With that in mind, you may want to refrain from making short trades. This means you’ll be going against the dominant trend, which can bring a fair number of risks.
If you are dealing with a downward dominant trend, then you should use a short timeframe to take shorter trades. When you see the signal, exit your short position. Make sure not to create a long position, as you will once more go against the dominant trend.
When adjusting the indicator settings, do it on both time frames. This way, you may create a couple of signals that you feel comfortable with. Keep it simple, especially if you are just beginning your career as a trader. With the right filters, you can increase your earnings.
7 golden rules of trading
Everyone has their own trading style, but some principles are critical for success. Make sure you’re following these basic rules of trading.
Read more

Calculation of Coppock curves
Coppock curves are calculated with the following precise formula:
WMA10 of (ROC14 + ROC11) = Coppock Curve
Each variable is important, and within the above-mentioned formula, you have the following:
· ROC11 – The 11-month rate of change

· ROC14 – The 14-month rate of change
· WMA – The 10-month weighted moving average
The Coppock is only one indicator that can influence your trading decisions. If you are investing in the long term, this may give you an idea of how an investment may perform in the years to follow.
How to use the coppock curve
We know the Coppock Indicator is a long-term analytical momentum-based oscillator. It does this based on Rate-Of-Change and includes a Weighted Pricing Average to smooth out the data.
Employing the Coppock curve, you can use either the Aroon Oscillator or the Klinger Oscillator. These are Coppock Oscillator Bars that are trusted for their high-level accuracy and user-friendly format.
The Aroon Oscillator is just an indicator that revolves around sustainable trends. It analyses the viability of a current market trend and the momentum’s possible durability. The Klinger Oscillator is a more technical analysis indicator that combines price movements with volume. Klinger uses increasing divergence and graph crossovers to generate trade signals.
Generally, you use the Coppock Oscillator Bar to recognize downward shifts and upturns in a Stock Market index in ten months. This is calculated as the ten-month WMA (Weighted Moving Average) sum of the 14-month change and the 14-month Rate Of Change for the index.
Formula:
—Coppock Curve = WMA↓10 of (ROC↓14 + ROC↓11)
—WMA↓10 represents the ten months Weighted Moving Average, and ROC represents the 14 monthly Rate Of Change.
Using this formula, you will understand security or ETFs’ price movements and momentum when you want to buy or sell.
Notably, the Coppock Oscillator Bar depicts price movements and momentum of stocks or underlying assets on a weighted average of ten months. This is displayed over a histogram that pinpoints major upturns or downturns in the market over each constituent month. This is spread over a fourteen months timeframe and redacted over the preceding eleven months to analyze the rate of change in the price movements.
To effectively use this analysis, understanding the Coppock Curve’s dynamics is essential. When the curve reading moves to the positive territory or any zone above zero, it is safe for the trader to buy off the underlying asset. However, on a reading of negative or below the zero mark, the trader can pick off the sell signal.
The role of the Coppock Oscillator bar in predicting market trends

Most importantly, the Oscillator displays the cumulative price direction of an underlying asset over a time frame in a legible manner.
Moreover, the Coppock Oscillator Bar can be merged with other technical momentum indicators to understand various aspects of the market. It can be used with the RSI (Relative Strength Index) Oscillator or the KST (Know Sure Thing) Oscillator. These oscillators can give you insight into different market behaviors and general tendencies. While observing the converging or diverging movements they depict can inform you of the price movements or when the asset is in overbought or in an oversold situation.
Careful utilization of the Coppock Oscillator Bar, with or without the combination of some other technical momentum indicators, will give you a better chance of success in the market.
Conclusively
The Coppock Oscillator Bar shows you precisely the price movements, weight, and momentum of your target asset over a weighted ten months period. It is also satisfying to see clear signals on when to buy underlying assets or sell if you can read the signs from the central line.
Trading with up to 90% profit
<span>Like</span>