What is technical analysis?
Technical analysis is a very popular type of analysis that traders worldwide use to forecast future price movements. It consists of two types of analysis: graphical type and mathematical type. What are they, and how to use them correctly on the Binomo platform? That’s the topic for today’s review.
Trading with up to 90% profit
Graphical technical analysis
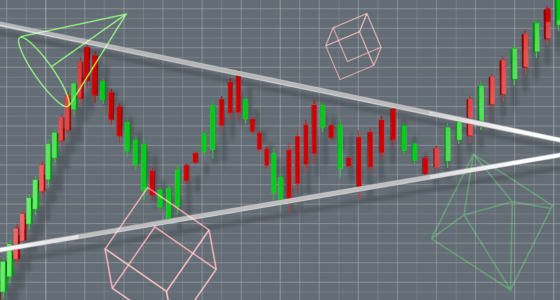
Graphical analysis uses different visual elements in the chart, e.g., horizontal and vertical lines, trend lines, etc. A trader may try to find support and resistance lines for the price with these lines. These lines are essential for making decisions about opening trades.
How to do technical analysis? A trader should link recent local price minimums to draw the support line. A trader connects the current local price maximum to draw a resistance line. The basic rule of technical analysis is that ‘history repeats.’ It means the next time the price approaches the resistance with a significant chance, it will bounce and fall. When it approaches the support – it may bounce and start rising. It’s almost impossible to trade if you don’t know how to use these lines. With Binomo’s graphical instruments, such as horizontal lines it will be easy to set all necessary levels in the chart.
With the help of graphical analysis, traders also try to find different chart patterns, such as head and shoulders, double tops/bottoms, and so on. There are two types of such patterns: reversal patterns, which warn traders about the trend change, and continuation patterns. The most well-known reversal patterns are head and shoulders, double tops, and double bottoms. The most well-known continuation patterns are flags and pennants. What’s important to know here? These patterns are most reliable after solid trends; the higher the timeframe, the better the patterns work.
Candlestick analysis and price action also refer to the graphical type.
There are more than 50 candlestick patterns that may help you understand where the price will go. The most popular candlestick patterns are engulfing patterns, piercing and dark-cloud cover patterns, and morning and evening stars. If you want to learn more about candlestick patterns read the classical book by Steve Nison which is called Japanese Candlestick Charting Technique, or go through the reviews in the Binomo blog.
Price action is a bit more modern type of analysis. Price action refers to Nial Fuller, and several articles explained all the necessary price action set-ups.
Effective strategies in your mailbox
Subscribe and discover a fund of trading knowledge
Great! Please check your email
We’ve sent you an email to confirm your subscription
Something went wrong
Try reloading the page. If that doesn’t help, please try again later
Mathematical technical analysis
Mathematical technical analysis uses different indicators – oscillators and trend indicators. Compared with the graphical analysis, mathematical analysis is more objective. Support and resistance lines may differ, depending on the trader’s point of view. At the same time, an indicator with the same settings and timeframes will always reflect the same situation on all traders’ screens. There are more than 500 indicators, but knowing all of them is useless. To trade successfully, traders must choose and use the most efficiently according to their strategy.
Start from $10, earn to $1000
Trend indicators usually help to identify the trend and find entry points in this trend. Several of the most popular indicators in the Binomo platform include moving averages, MACD lines, and Parabolic SAR. The ones who prefer a more complicated approach may find Ichimoku Cloud or use the Directional Movement Index.
Traders mostly use oscillators in flats. Flats usually take around 70-75% of all price movements, so you should learn at least several popular oscillators to trade efficiently. Pay attention to the Relative strength index, Stochastic indicator, or Williams %R. These indicators are almost the same and are counted by the same formula. Pay attention to Donald Lambert’s Commodity Channel Index (CCI) too. All these indicators are available on the Binomo platform.
7 golden rules of trading
Everyone has their own trading style, but some principles are critical for success. Make sure you’re following these basic rules of trading.
Read more

How to perform technical analysis?
While using indicators, pay attention to the settings and to the timeframe. Usually, default settings are enough to find good entry points, but sometimes you need to change them.
Conclusion
Technical analysis trading is a really popular approach. With Binomo, you’ll learn how to use this approach the best. If you liked our review, don’t forget to leave us likes and give us your feedback.
Earn profit in 1 minute
+1 <span>Like</span>