Breakout trading is one of the popular trading approaches. It allows traders to enter a newly formed trend at the best possible levels—or to trade in the existing trend with a high probability of its continuation.
However, some breakouts turn into fakeouts, so traders open losing trades.
According to statistics, 70-80% of breakouts turn into fakeouts.
Below, you will find some rules on identifying strong breakouts and trading them effectively.
Start from $10, earn to $1000
What is a breakout?
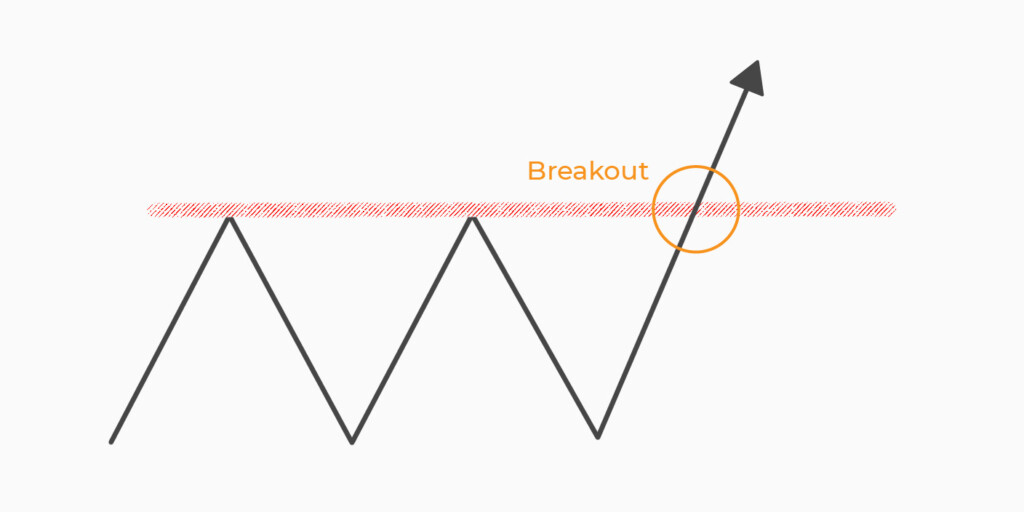
A breakout is a market condition in which a price breaks above a solid resistance level or below a strong support level and continues moving in the breakout direction. During a breakout trade, the trader buys when the price rises above the resistance point and sells when the price moves below the support point. Usually, the price consolidates for a while before breaking beyond a strong level.
Traders look for breakouts because they signal increased price volatility, significant price swings, and, often, strong price trends. Breakouts are a universal trading tool, as they can occur in any timeframe and on the chart of any asset. Therefore, many beginner traders start with breakout trading.
However, not every break beyond a strong level turns into a breakout. Sometimes the price breaks beyond but turns around. Such a situation is called a false breakout—or a fakeout—and leads to losses, even though traders commonly use stop-loss levels.

How to identify a breakout then? There are several tools you can use to distinguish between breakouts and fakeouts.
Effective strategies in your mailbox
Subscribe and discover a fund of trading knowledge
Great! Please check your email
We’ve sent you an email to confirm your subscription
Something went wrong
Try reloading the page. If that doesn’t help, please try again later
High volume
The main difference between a fakeout and a breakout is the degree of the trading volume. When the price breaks beyond a strong level, trading volumes must increase. If volumes stay at the same level or decrease, there is a high risk of a fakeout.
The volumes must increase on a breakout because the price usually consolidates before breaking beyond a strong level, and during the consolidation, volumes are low. A consolidation happens due to market uncertainties. Buyers or sellers need a reason for the price to move in a particular direction. Before they find a reason, the price will move within a narrow range.
To identify an increase in volume, traders implement volume indicators. The most popular tools are on-balance volume, Money Flow Index, the accumulation and distribution indicator, and the Klinger oscillator.
Besides increased volumes, traders often look at increased volatility. A high level of volatility is usually caused by important fundamental events such as economic data releases, earnings reports, and macroeconomic and political news. However, it’s vital to remember that increased volatility bears high risks, as it may be short-term. This will result in a quick price reversal.
Strong support and resistance levels
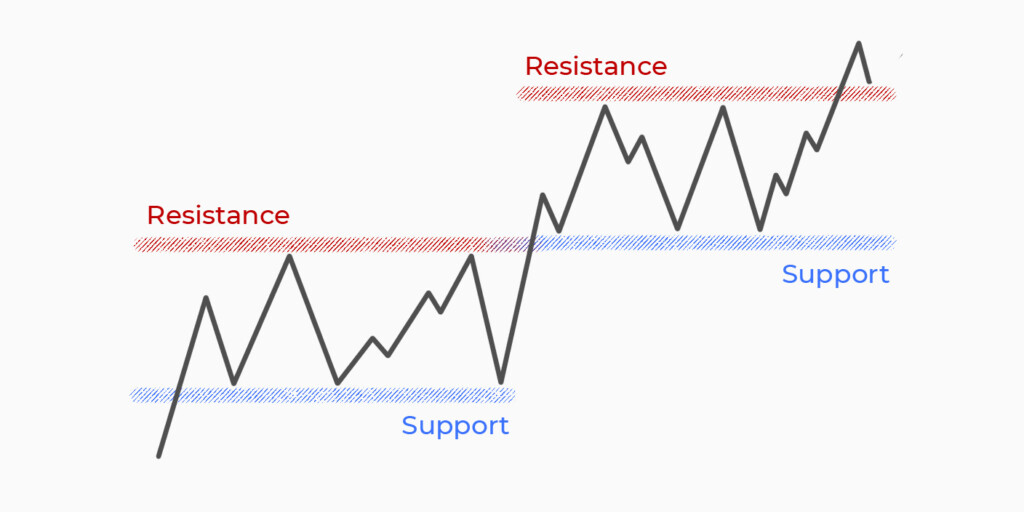
To identify a breakout, you should first determine strong support and resistance levels. One of the signs of a false breakout is a random level, at which a break doesn’t say much to traders. A breakout may occur even at levels the price touched twice; however, if there are more touches, the chances of a strong breakout are higher.
Earn profit in 1 minute
To determine the strength of support and resistance levels, traders can consider volumes every time the price touches the level. If volumes are high, the level is considered strong because it means bulls or bears couldn’t break the level despite significant forces.

Additionally, traders use technical analysis indicators to determine reliable support and resistance points. Moving averages (MAs) are one of them. When the price falls to the MA, it serves as a support level. Conversely, when the price rises to the MA, it serves as a resistance level. If the price breaks beyond the MA, this can be considered a strong breakout. However, it’s vital to choose a period of the moving average. A fast MA will create more signals, but they have a higher risk of being incorrect.
5 best coffee types for traders
Coffee is a great beverage for traders. A few daily cups of coffee improves the mind and enables you to make better trading decisions. Check it out!
Read more

Range
As the price usually consolidates before a breakout, a move in a range is the most common price behavior. A range is a market condition in which the price moves sideways between support and resistance levels. The rule says that the length of the range identifies the strength of a breakout–the longer the range, the stronger the breakout.
To determine a breakout point, pay attention to how often the price touches a particular level. If it mainly fluctuates near the resistance level, the chance it breaks above it soon is high. If it moves near the support level most of the time, it will likely fall below support soon.
Ranges allow traders to identify effective stop-loss levels. Usually, when the price breaks above the resistance, traders place a stop-loss order slightly below it. Conversely, a stop-loss order is set slightly above the support level when it falls below it.
Chart pattern breakouts
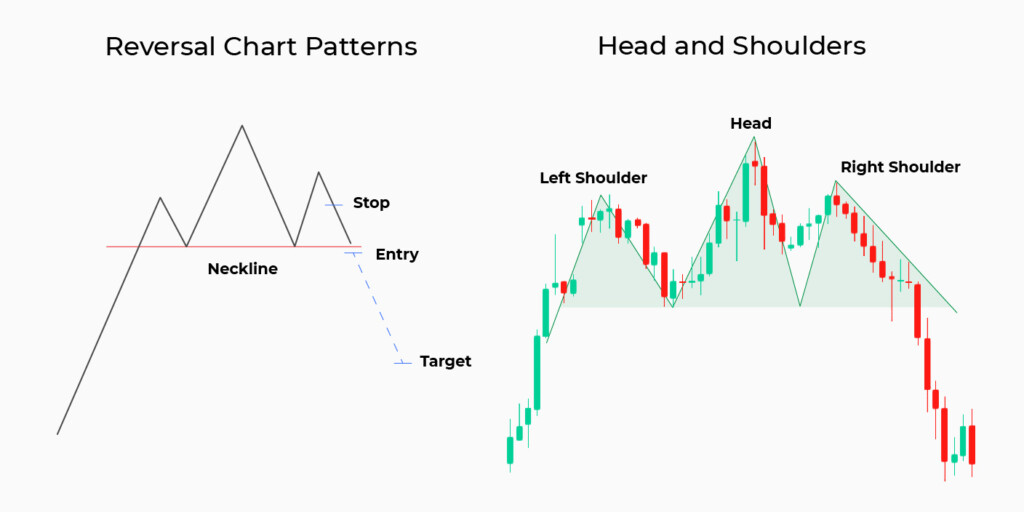
Chart patterns are another simple way to spot breakout points. Most of them are based on the breakout rule. For instance, when trading on a head and shoulders pattern, traders wait for the price to break below the neckline (support level); when trading on an ascending triangle pattern, traders look for the price to rise above its upper trendline.
When considering patterns, you will notice that price consolidation does not always occur before a breakout. Sometimes, there are significant swings before the price breaks a strong level. Head and shoulders and double top patterns are examples of large swings before a breakout.
Every pattern has its own rules, so you know the entry, take-profit, and stop-loss points without hours of testing. Of course, they must be set according to current market conditions, the asset you’re trading, and your trading approach. But generally, traders enter the market after a breakout candlestick closes below the neckline of the head and shoulders pattern, place a stop-loss above the neckline, and set a take-profit target equal to the distance between the head and the neckline.
New highs and lows

To identify a breakout condition, traders can look for new highs and lows. Here, the psychological factor takes place. If the price sets a new high, there are little to no selling forces in the market. Considering new highs, a trader believes other traders think the asset is attractive for trading. Therefore, more and more traders enter the market and push the price up. Significant bull forces can ensure a strong breakout. To identify a breakout point, you can consider the nearest resistance levels.
The opposite rules apply to short trades. As trading allows for both buying and selling assets, traders can look for new lows. When the price continues moving down, a trader considers it a sign that other traders believe the asset will depreciate. More and more traders open short trades so that the price may break below the nearest strong support level.
However, you should remember that the price can’t constantly rise or fall; at some point, it will turn around. In the case of a reversal, traders should wait for the price to break above the nearest support after a downtrend and for the price to break below the nearest resistance level after an uptrend.
Long-term trend
To confirm a breakout, traders can consider trends in higher timeframes. For instance, if you look for a break above the resistance level on an hourly chart, you can consider a daily chart to identify the overall trend. If the trend is bullish, the breakout will likely be strong.
If you decide to go against the trend, you will likely bear losses; this is because trends are created not by retail traders but by large institutional traders. This means you can’t compete with institutional traders, and you won’t be able to change the market direction.
However, you should remember that the trend can continue indefinitely. You should determine its strength before you trade on a breakout. A trend’s strength can be identified with technical analysis indicators, including the average directional index (ADX).
Final thoughts
Breakout trading is one of the simplest trading approaches that can be used even by newbies. However, it’s vital to learn how to distinguish between real breakouts and false breaks. Before you look for breakouts on a live chart, you should test breakout trading on historical data or a demo account.
Sources:
The Anatomy of Trading Breakouts, Investopedia
7 Steps to follow when Trading Breakout Stocks, elearnmarkets
How to Identify a High Probability Breakout Trade, Warrior Trading
Trading with up to 90% profit
<span>Like</span>