
Trading with indicators is one of the most straightforward approaches. Of course, it has its unique requirements. However, if you learn some most effective standard tools, what parameters work best, and how to combine the indicators, you are more likely to succeed.
Interestingly, an Amsterdam merchant from the 17th century, Joseph de la Vega, wrote notes about the Dutch financial markets, and they showed some aspects of technical analysis.
Trading with up to 90% profit
If technical analysis appeared centuries ago, you should definitely learn how to trade with indicators.
How to choose indicators: a step-by-step guide
To trade with indicators successfully, you need to learn how they look, what signals they provide, what timeframe they work on, and what settings are the most effective.
1. Choose indicators
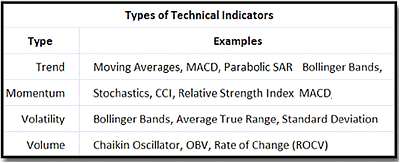
There are numerous indicators. However, it’s best to start with the most popular ones: RSI, MACD, Stochastic, Awesome Oscillator, Bollinger Bands, Fibonacci levels, and volume. These are the simplest and most effective tools that won’t require lots of your time to learn them. Later, you can implement something exotic into your strategy. But don’t take risks at the beginning.
Indicators are divided into several groups by their aim. To choose those that will work for your strategy, determine your aim. Pay attention to trend and volume indicators if you need to identify a trend reversal. If you’re looking for shorter-term trades, consider momentum and volume tools.
2. Learn the settings and constituents of an indicator
All indicators have standard settings. These are the settings that work in most cases. However, they can’t work similarly on low and high timeframes. Therefore, you need to test different settings on the timeframe you choose. Remember that the indicator may provide wrong signals. Therefore, you need to calculate how many correct and incorrect signals it gives. You can use the tool without a doubt if there are more correct signals.
Also, it’s vital to understand what indicator consists of. Many tools have base and signal lines. Some consist of numerous lines. You need to understand what each element stands for. Otherwise, you won’t be able to read their signals.
3. Learn signals
After you choose indicators, you need to understand how to read their alerts. Usually, they give more than one signal. Learn all of them.
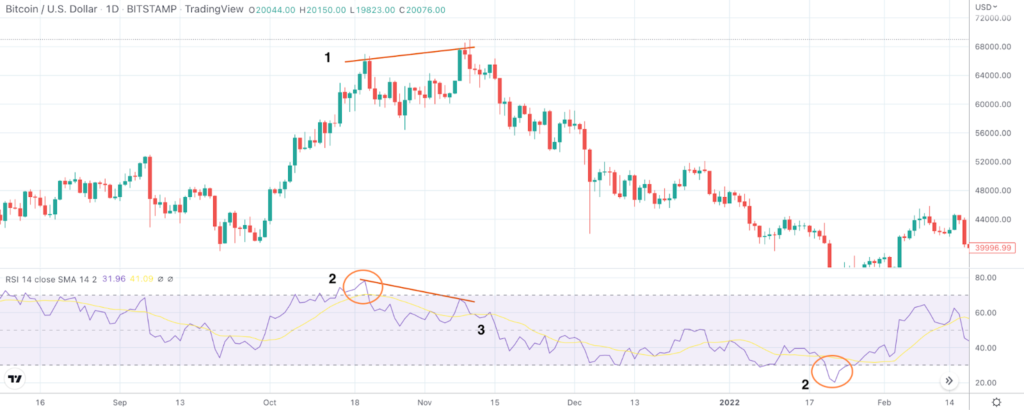
For example, the chart above shows that the RSI indicator alone may provide three signals.
- It reflects a bearish divergence with the price chart, which is a sell signal (1).
- It depicts oversold and overbought areas, which are sell and buy signals, respectively (2).
- When the RSI (violet line) breaks below the RSI-based MA (yellow line), it’s a confirmation of the price fall (3).
Effective strategies in your mailbox
Subscribe and discover a fund of trading knowledge
Great! Please check your email
We’ve sent you an email to confirm your subscription
Something went wrong
Try reloading the page. If that doesn’t help, please try again later
Practice with indicators
After you choose indicators, you need to practice. It’s vital to start with historical data and a demo account. Evaluate how the indicator behaves with different assets. For instance, crypto trading with indicators will differ from Forex trading with indicators. Currencies are more stable than cryptocurrencies. Therefore, you can apply lagging indicators for currency trading. When you try to catch signals for assets with significant price fluctuations, you need to base your approach on leading indicators.
5 of the best scalping indicators to use right away
You can experiment with various indicators, but there are some you can use right away to build your best scalping strategy.
Read more

Forming a trading strategy with indicators
There is no trading strategy that will suit all indicators. Trading approaches differ — some may have chart or candlestick patterns; some will be based on indicators only. However, you should remember that every signal of a technical indicator must be confirmed. Combine 2-3 indicators of different types and consider the unique features of the asset you trade.
Is trading without indicators possible?
Yes, it’s possible to trade without indicators but not recommended. You can use candlestick and chart patterns. However, chart patterns are quite rare, while candlestick patterns always need to be confirmed. You can use fundamental analysis only. However, fundamental events seldom appear. Therefore, this approach is acceptable if you plan to trade from time to time. If you want to make trading your job, you will suffer to find signals.
Earn profit in 1 minute
<span>Like</span>