For investors in the stock market, pullback trading strategies are a popular technique. This is down to the fact that they’re easy to identify and have a good track record for returns.

The strategy involves having an understanding of the conditions of the market and knowing what a pullback is. After identifying a trend, you also need to understand how to establish the indicators to find the trade entry/exit points.
The idea of a pullback trading strategy is that herd mentality is good. In this article, we’ll tell you all about this strategy with some candle graphs to explain pullbacks.
Trading with up to 90% profit
Pullback strategies – the 101
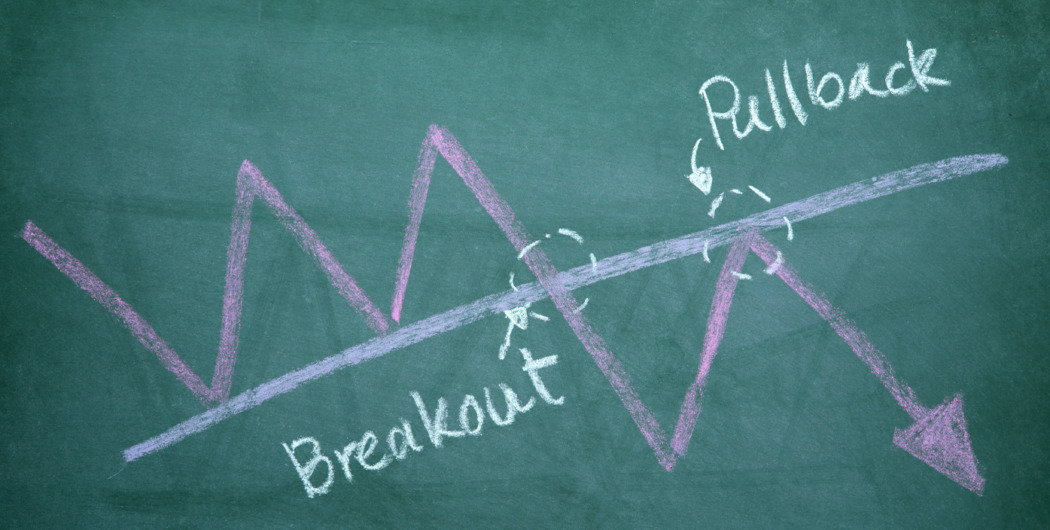
It’s much easier to explain a market pullback by looking at a chart. The pullback trading strategy is based on the fact that prices don’t just move on an upwards trajectory.
While, in the long-term, the trend will be that prices rise, there are occasions when there is a little uncertainty and the stock markets then have chances to buy at lower prices. These pullback strategies work in all markets and over any given time frame.
Effective strategies in your mailbox
Subscribe and discover a fund of trading knowledge
Great! Please check your email
We’ve sent you an email to confirm your subscription
Something went wrong
Try reloading the page. If that doesn’t help, please try again later
Pullback trading strategy in a downward trend
For a long time, pullback trading was associated primarily with a bullish equity market. The upward trends each year have encouraged many equity investors to ‘buy in the dips’.
Though pullback trading has been associated with these upward trends, you can still apply the same principles to downward trends.
The difference between retracements and pullbacks

Often, the term retracement is used synonymously with pullback. The strategy of retracement is simply describing when the price is going in the opposite direction to the trend over the long-term.
While there are strategies that specialise in retracement trading opportunities, these come with additional risks since they’re going against the momentum of the market overall. This means that if they go wrong, any losses could be magnified.

Though used interchangeably, retracements are typically seen as being a longer-lived trend compared to a pullback.
The difference between a correction, a reversal and a pullback
A correction is when the market price reverses by at least 10% from the annual high. A correction can take a little time to happen and for major stock indices, it’s actually quite rare.
A reversal is usually the term used to talk about a shift in the dynamics of the market. This could happen when a firm announces market news and people believe it is overvalued.
Conversely, a pullback will describe the time when the pressure to buy subsides a little, but ultimately, the situation has not changed overall.
Cryptocurrencies: what to expect in 2023
2023 is expected to be the year of recovery for the crypto market. Read on to see what to expect in 2023 for cryptocurrencies.
Read more

Identifying trends
There are many ways to identify trends. One of the main ones to look for is using the price action.
You should consider the “higher highs and higher lows” for markets on the up. For markets in a downward trend, you need to look out for “lower lows and lower highs”.
Identifying pullbacks
You need patience to trade pullbacks. A price movement is a big sign that a pullback is impending – essentially, the price is falling from its peak. You can consider other metrics, of course, to help you decide when to step in and trade.
Whenever the price begins to shift in direction, there is always a chance that this move might not be short-lived.
If there is an increase in trading volumes when the trade reversal occurs, it could be a sign that it is fundamental. If, however, the volumes are consistent, the price move might be shorter in nature.
If a price move has been triggered by company news or market events, it might mean that there is a change in how people see its value. As a result, the move in price is likely to be longer-lasting and greater.
If trend lines or other technical indicators are supporting the price, then it could mean buyers are running out of momentum temporarily. They’re still there, but they’re working at lower prices. If the prices crash further through these support levels, it’s a sign that the change in price could be based on another factor.
Earn profit in 1 minute
<span>Like</span>