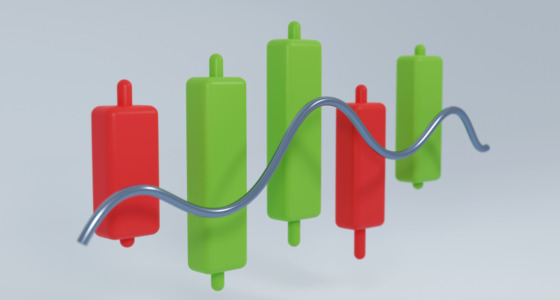

Oscillators are technical indicators in trading that trend below and above a line centered between set levels. Trading oscillators can sustain a position at overbought or oversold levels for a time but cannot keep trending for a prolonged period. In contrast, a culminating indicator such as the On-Balance-Volume (OBV) can sustain a trend; even as it increases, it decreases in its value.
There are different lists of trading oscillators, but we will focus on the two major categories, even as we touch on their advantages and disadvantages. One of the broad categories of trading oscillators is the “centered oscillators,” which increase and decrease below and above the center line or point. In contrast, the banded oscillator fluctuates between overbought and oversold extremes.
In general, centered trading oscillators are ideal for technically analyzing which direction price momentum is headed. On the other hand, banded oscillators are used to identify overbought and oversold levels.
Let’s take a closer look at it:
Centered oscillators
To buttress our earlier discussed point, centered oscillators are suitable for determining price momentum’s strength, weakness, or direction. In its crude state, the price momentum of a security is considered bullish or positive when the centered oscillator trades above the center line. In the same way, it is considered bearish or negative when it trades below the centerline.
Banded oscillators
A closer look at banded oscillators shows a fluctuation between two bands representing extreme levels. The low outer band signifies oversold levels, while the high band signifies overbought levels.
The Stochastic Oscillator and the Relative Strength Index (RSI) are good examples of banded oscillators. These bands are usually based on the oscillator and slightly change as you switch securities. This allows traders to identify overbought and oversold signs quickly.
Pros and cons of trading oscillators
As you trade using these technical Indicators, you will discover several benefits and challenges. Below is a list of pros and cons of trading oscillators.

Pros of Oscillators
1. Gives clear entry and exit signals
Trading oscillators give traders a clear sign of entry and exit levels. This is because oscillators have an explanatory design that visually signals to the trader whenever it reaches any extreme group. Traders can use this to determine when to sell or buy stocks.
2. Very easy to understand
Oscillators whose fluctuating lines go from 0 to 100 are always easy to be understood by traders and investors.
3. Pips are frequent
For traders who are actively into trading intraday charts like the 15-minute time frame, oscillators are a great way of providing more frequent pips as price momentum fluctuates in a similar direction.
4. Trading oscillators are on most platforms
You’ll find different trading oscillators on most trading platforms because they are a valuable part of technical analysis.
Cons of oscillators
Despite the benefits of trading oscillators, it still has some disadvantages:
1. Its-charts could be misleading especially during trends
Different traders have different strategies and depending on the time frame they have chosen, traders can misconceive sharp oscillators as indicators to either buy or sell, mainly when it fluctuates contrary to the trend. This type of false chart is shared in a volatile market.
2. They don’t measure the direction of the trend.
Stochastic oscillators are mainly used to identify the weakness or strength of the price action, not the direction or trend.
Final notes
Having understood the basics of trading indicators, their pros, and cons, you can be sure to maximize them in your daily trading analysis. Bear in mind that there are other oscillator types in addition to the banded and centered oscillators, but we have streamlined our category to the two broadest.
You can always try out your hands on any of the oscillator types that is ideal for your trading strategy, and that’s after you know the pros and cons attached.


