
Despite a common misconception, market volatility always exists, whether it’s high or low. Both volatility grades have unique features that traders consider before entering the market. However, high volatility bears higher risks. Therefore, traders constantly search for tools and indicators to help them limit the risks. What are the most used technical indicators that measure price volatility? You will find them below.
Earn profit in 1 minute
Did you know that in 2019, JPMorgan Chase developed the Volfefe Index for US Treasury bonds that measured the volatility caused by former President Donald Trump’s tweets?
What is a volatility indicator?
There are four main indicator types: trend, momentum, volume, and volatility. The latter allows traders to identify periods of low and high volatility. While low volatility doesn’t cause increased risks, high volatility represented by significant price fluctuations may trigger a stop-loss order, leading to wrong trading decisions and an inability to analyze the market. Still, it’s vital to understand that high volatility bears risks but provides trading opportunities. Experienced traders use large price movements to gain considerable rewards in the short term.
How to use technical indicators? Volatility indicators don’t provide accurate entry and exit points. They help traders evaluate market conditions and can be used as an additional method to confirm trading decisions.
Effective strategies in your mailbox
Subscribe and discover a fund of trading knowledge
Great! Please check your email
We’ve sent you an email to confirm your subscription
Something went wrong
Try reloading the page. If that doesn’t help, please try again later
Bollinger bands
Bollinger Bands are a popular technical analysis tool. It consists of three lines: the middle line is a 20-period moving average, the upper band is a moving average with a +2 standard deviation, and the lower band is a moving average with a -2 standard deviation.
When the lines expand, the market experiences high volatility. When they contract, the price volatility is low. The bands usually move closer to the middle line in periods of price consolidation (1) and diverge when the market enters a solid trend (2).
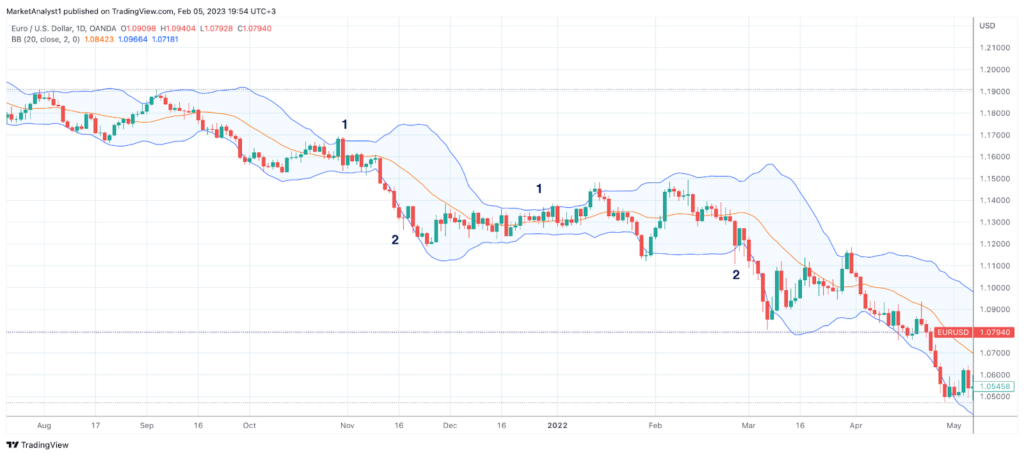
Traders also use Bollinger Bands to identify future price directions: when the price touches the upper band, it may fall soon; when the price touches the lower band, it may rise shortly.
Average true range (ATR)
The average true range indicator consists of a single line that moves up and down. When the indicator moves up, the volatility degree increases; if it moves down, the volatility level decreases.
Trading with up to 90% profit
The ATR doesn’t have a particular value for high and low volatility. To determine the rising volatility degree, you should evaluate the indicator’s recent value and take it as an average. If the line rises above the average, the volatility degree increases. If it moves below the average, the volatility degree decreases.
The ATR is a lagging indicator, meaning it reflects the level of volatility with a delay. However, this pitfall doesn’t make the ATR less effective.
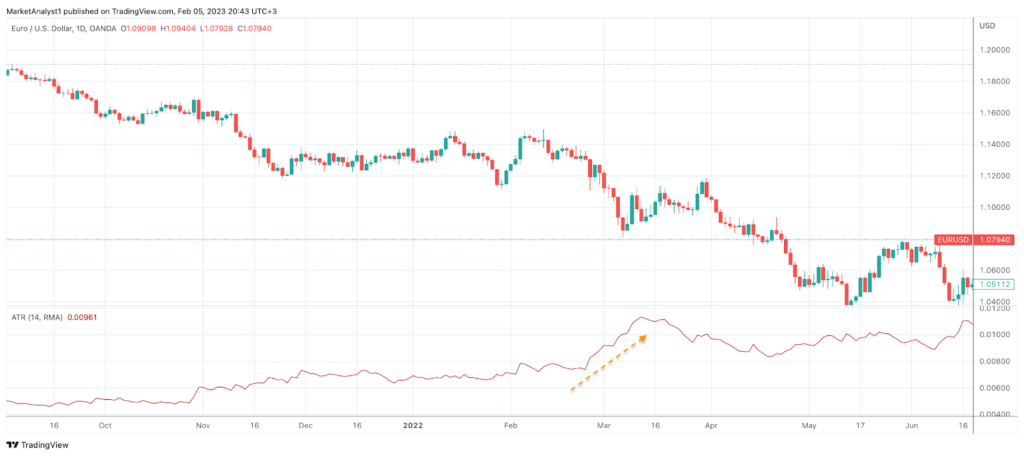
Note: the indicator doesn’t reflect the trend direction – it can rise in a downtrend and fall in an uptrend.
Cryptocurrencies: what to expect in 2023
2023 is expected to be the year of recovery for the crypto market. Read on to see what to expect in 2023 for cryptocurrencies.
Read more

Keltner channel
The Keltner Channel looks like a combination of two previous indicators. It consists of three lines like the Bollinger Bands and is based on ATR values. The middle line is a 20-period exponential moving average. The upper band is a sum of the exponential moving average and doubled ATR value. The lower band is a difference between the exponential moving average and a doubled ATR value.
The middle line is considered the mean price value. The further the price moves from it, the higher the volatility level is. This is because the lower band is determined as an oversold level, and the upper band is considered an overbought level.
The primary signal traders look for is a change in a price direction. Usually, when the price rises above the upper band of the Keltner channel in an uptrend, the price is expected to decline soon. Conversely, when the price moves beyond the lower band in a downtrend, it is expected to rise shortly.
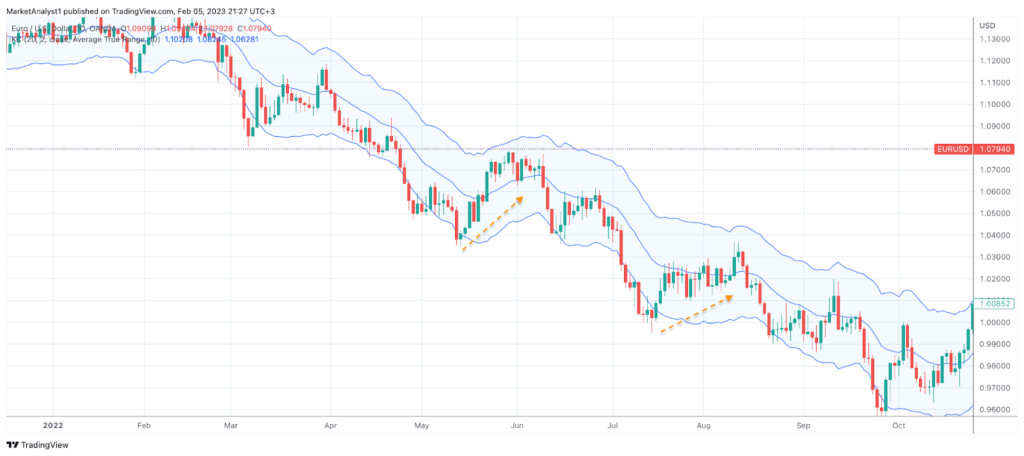
Note: a change in a price doesn’t necessarily signal a trend reversal. For instance, if you use the indicator on a chart with a high timeframe and a solid trend, the indicator may signal a short-term price reversal.
Does technical indicator work?
A technical indicator works if you know how to use it. It’s vital to learn indicator unique features and practice. Moreover, you should remember that volatility indicators aren’t primary tools to identify entry and exit points. Therefore, you should combine them with other indicators. How many technical indicators should I use? The theory says traders apply 2-3 indicators to confirm signals. If you use more indicators, you risk being confused with their noise.
Sources:
What Is Market Volatility—And How Should You Manage It?, Investopedia
5 Important Volatility Indicators that Traders should know, elearnmarkets.com
Market Indicators That Reflect Volatility in the Stock Market, Investopedia
Start from $10, earn to $1000
<span>Like</span>