Swing trading has long enticed traders seeking to ride the waves of market momentum. And when it comes to desirable stocks for swing trading, Apple stands out prominently. By the way, did you know that Apple’s very first computer was sold for the intriguing price of $666.66? Fast forward to today, and it’s astonishing to note that Apple currently holds more cash in its coffers than some governments.
Now, imagine using this financial giant’s stock or another asset for swing trading on Binomo. In this article, let’s equip you with the best swing trading strategies so that you don’t have to imagine.
Start from $10, earn to $1000
What are swing trading strategies?
Swing trading strategies involve a distinct approach to trading in the financial markets. Traders who adopt this strategy buy or sell assets and maintain their positions for a medium-term period, usually ranging from a few days to several weeks. The primary objective of swing trading is to capitalize on price movements, commonly referred to as swings, within the market.
Unlike long-term trading, where assets are held for weeks or even months, or day trading, where positions are opened and closed within a single trading day, swing traders take the middle ground. By capturing intermediate price movements, they want to achieve consistent profits over time.
How does swing trading operate?

A swing trader engages in a meticulous analysis of trading patterns, and this scrutiny helps them decide the optimal moments to buy or sell an asset. Technical analysis, a cornerstone of swing trading, thrives on the active trading and high liquidity offered by large-cap stocks. Other potentially rewarding assets would be cryptocurrencies and forex pairs.
This process itself entails searching for trade setups that tend to result in predictable movements in an asset’s price. It’s important to note that this task isn’t simple, and no single strategy or setup is infallible. The key lies in maintaining a favorable risk/reward ratio.
Effective strategies in your mailbox
Subscribe and discover a fund of trading knowledge
Great! Please check your email
We’ve sent you an email to confirm your subscription
Something went wrong
Try reloading the page. If that doesn’t help, please try again later
Fibonacci retracement pullback
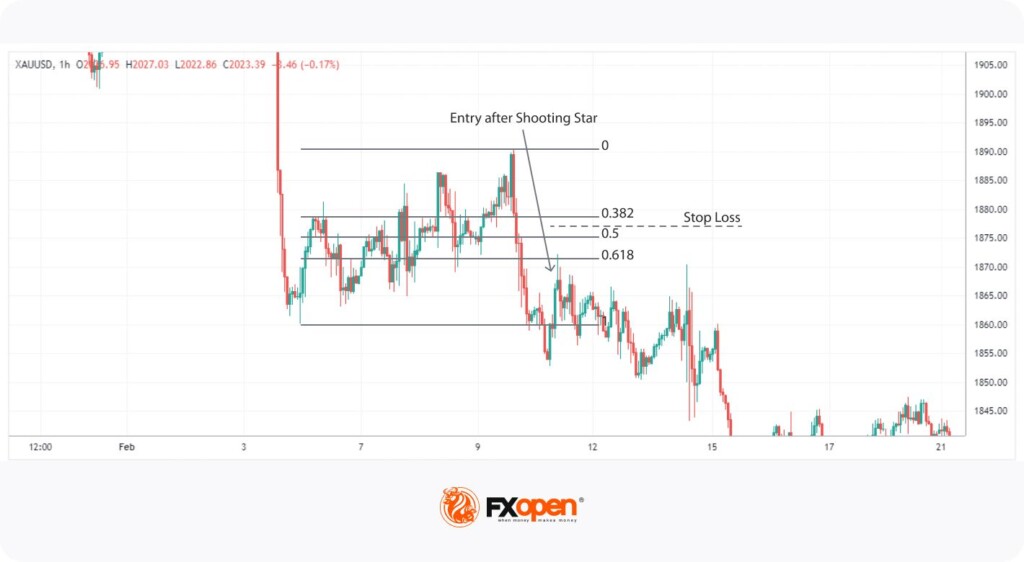
To put the first strategy into action, you start by setting up the Fibonacci retracement. You identify the overarching trend within your chosen timeframe and mark the most recent noteworthy high and low points within that trend. If you’re analyzing an uptrend, the first point is assigned to the low and the second to the high. The process is reversed for a downtrend.
As the price nears the 38.2%, 50%, or 61.8% levels, you’re on the lookout for signals of a potential reversal. This is where candlestick patterns like the hammer and shooting star come into play — simple yet effective tools for spotting changes in direction. Once the candle has closed, confirming the pattern, it’s a potential entry point.
For stop loss, you have a few options: you can either place it a bit away from where you started the trade, at the next level in the Fibonacci numbers, or all the way at the highest or lowest point of the retracement tool. Depends on how much risk you’re willing to take.
To take profits, you can do this around the highest or lowest point of the retracement. Another choice is to do it at the next big level, where the price is likely to either get support or hit resistance.
Bollinger Bands with an impulsive candle
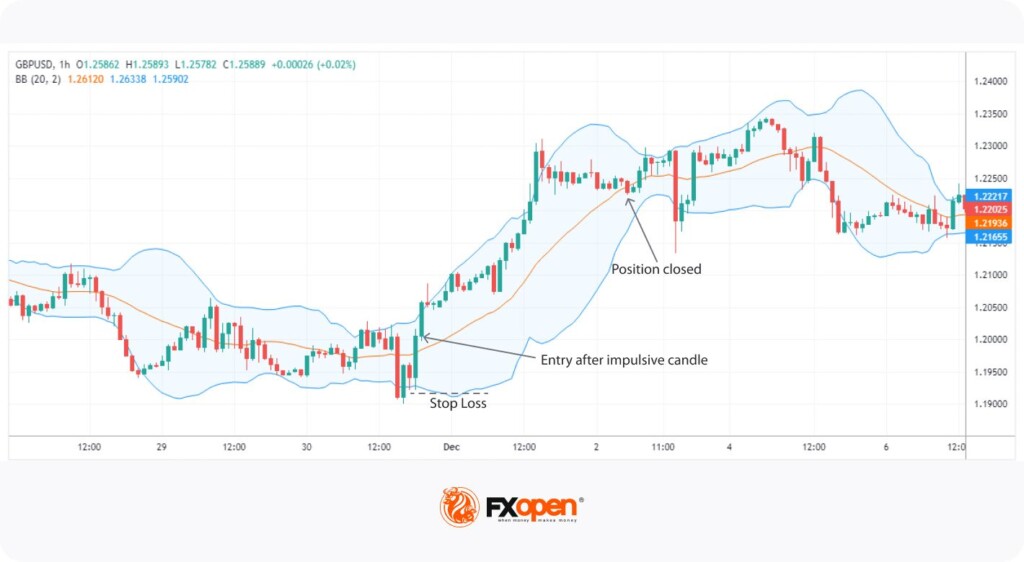
For this technique, you can stick with the regular settings of the Bollinger Bands. The average line should consider the past 20 prices, and the other lines are set with a standard deviation of 2.
Trading with up to 90% profit
Here’s the main point: pay attention to what happens when the price touches or goes beyond one of these lines. Then, give it some time. You’re waiting for a specific strong candle that goes right through that average line. This kind of indicates that the direction could change, and the trend might keep going. It’s even better if this candle closes really close to its highest or lowest point, so it’s a strong signal.

Once you see this strong candle, that’s your cue; get ready to take action when that candle is done. You’ve got a few choices for where to place a safety net (stop loss) — you can put it slightly above or below that strong candle or even outside those Bollinger Bands. Generally, traders finish up the trade if the price goes back above or below that average line.
5 of the best scalping indicators to use right away
You can experiment with various indicators, but there are some you can use right away to build your best scalping strategy.
Read more

RSI divergence
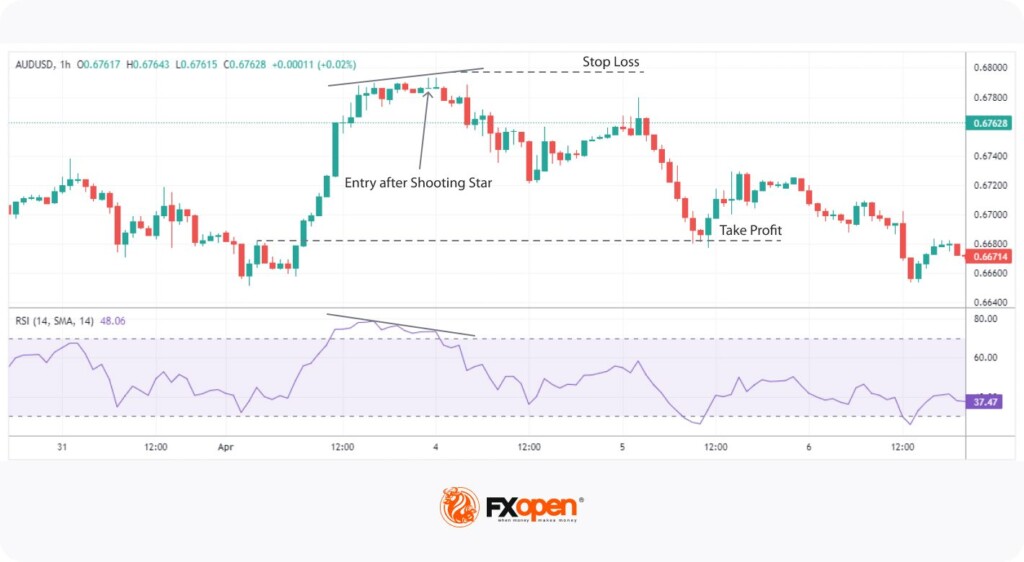
For this approach, make sure you have the RSI indicator set to its default value of 14. Your first step is to wait until the RSI crosses either the 30 or 70 level. Once that occurs, keep your eyes open for a divergence between the RSI and the price movement. These divergences typically emerge when the price interacts with support or resistance points.
As soon as you notice this divergence, maintain patience for a candlestick pattern like a hammer or shooting star to make an appearance. Once that particular candle closes, you’re good to initiate your trade.
In contrast to the strategies discussed earlier, this method doesn’t prescribe a specific place to position your stop loss. However, you can place it slightly beyond the candle that marked your entry. And then you can exit the trade with a profit when the RSI enters the overbought or oversold zone (depending on whether you’re trading in an uptrend or a downtrend).
Keltner channel breakout
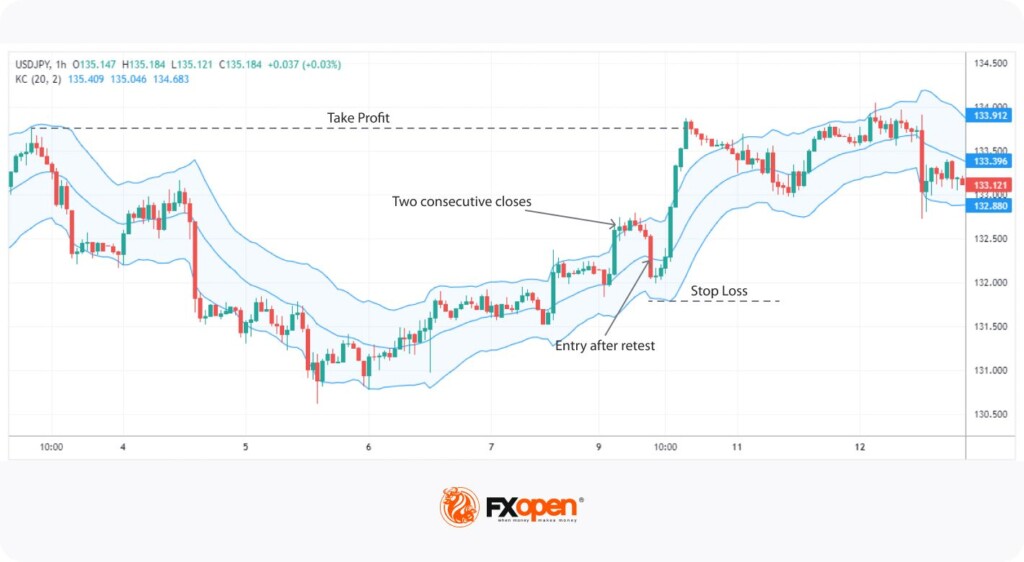
For swing traders aiming to ride trends, the Keltner channels offer a useful edge. After you’ve identified a strong trend, turn to these channels to guide your entry points.
Start by adjusting the indicator using an ATR length of 20 and a multiplier of 2. Next, watch for two consecutive periods where closing prices extend beyond the channel’s edges. Once you spot these two closes, keep an eye on the price as it pulls back to touch the exponential moving average line. When the price meets this line, it’s time to act.
Consider placing a stop loss just slightly beyond the opposite channel line. As for locking in profits, you can take them at nearby support and resistance levels. Or you can think about gradually adjusting your trailing stop loss just behind the opposite channel line as your trade unfolds.
MACD crossover
MACD crossover may be one of those high-probability swing trading strategies, which is simpler but can be more high-risk. Here, traders buy when the MACD line crosses above the zero line and sell in the opposite case.
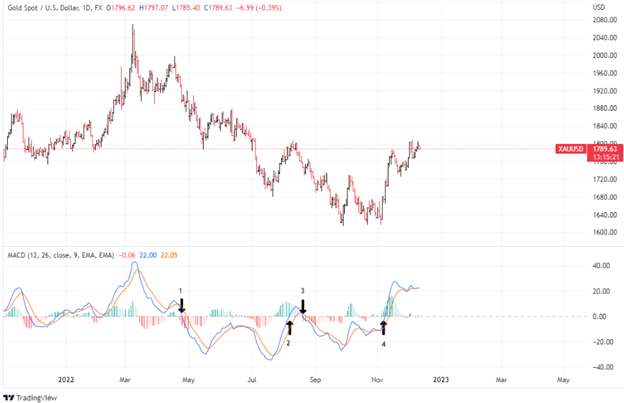

During the timeframe in the chart above, there were four signals in total, with three of those hypothetically giving favorable trades. While taking a position on the crossover of the MACD line and the signal line can potentially help you enter the trade earlier, waiting for a break above and below the zero line helps ensure that a trend is surely in place and hopefully limits the whipsaws.
Granted, you can’t dodge false signals altogether, such as the instance marked as signal number 2, which would have led to a losing trade. However, this example managed to exit the trade tied to signal number 3 relatively quickly, curbing the potential losses.
MACD divergence
In this method, you’re essentially comparing the peaks and valleys of the MACD with those of the price line. The goal is to identify moments when the oscillator’s behavior doesn’t match the ongoing price trend.
Usually, when the price makes a new high, you’d expect the MACD line to follow suit, reaching a new high as well. Likewise, a new low in price would correspond to a new low in the MACD line. But when the price and the line start moving in opposite directions, there is a divergence, which acts as a preliminary signal that a potential shift in the trend might be in the pipeline.
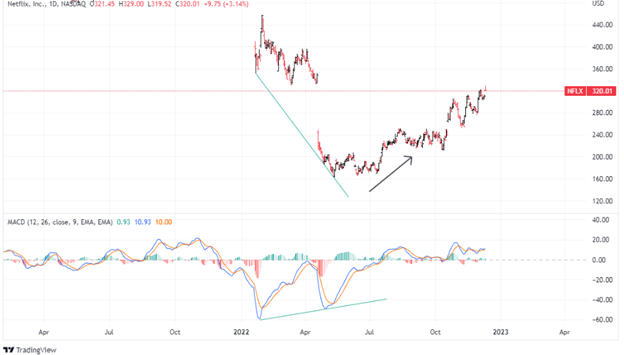
Take a look at the chart above to clearly see an example of such a divergence. As prices declined, the MACD didn’t reflect the drop. Following this, prices hit a low point and then initiated a rally. It’s crucial to understand that a divergence doesn’t automatically imply you should execute a trade. Rather, it’s more of a cautionary alert. For instance, if you held a short position, noticing a divergence could signify it’s time to wrap up that position (ideally, with a favorable outcome).
Interestingly, Gerald Appel, the individual behind MACD, acknowledged that divergences tend to offer some of the most potent buy and sell signals. While this might not be a universal truth, historical consistency suggests that spotting such divergences can be a fairly reliable way to anticipate potential market movements.
Support and resistance triggers
For a swing trader, the support bounce is an opportunity to consider a buy trade, with a safety net positioned just below the support line. On the flip side, the resistance bounce could signal a chance for a sell position, guarded by a stop loss set above the resistance line.
An important point to remember is that support and resistance roles flip when the price breaches them — a past support becomes a future resistance and vice versa.
Bull flag on a daily chart
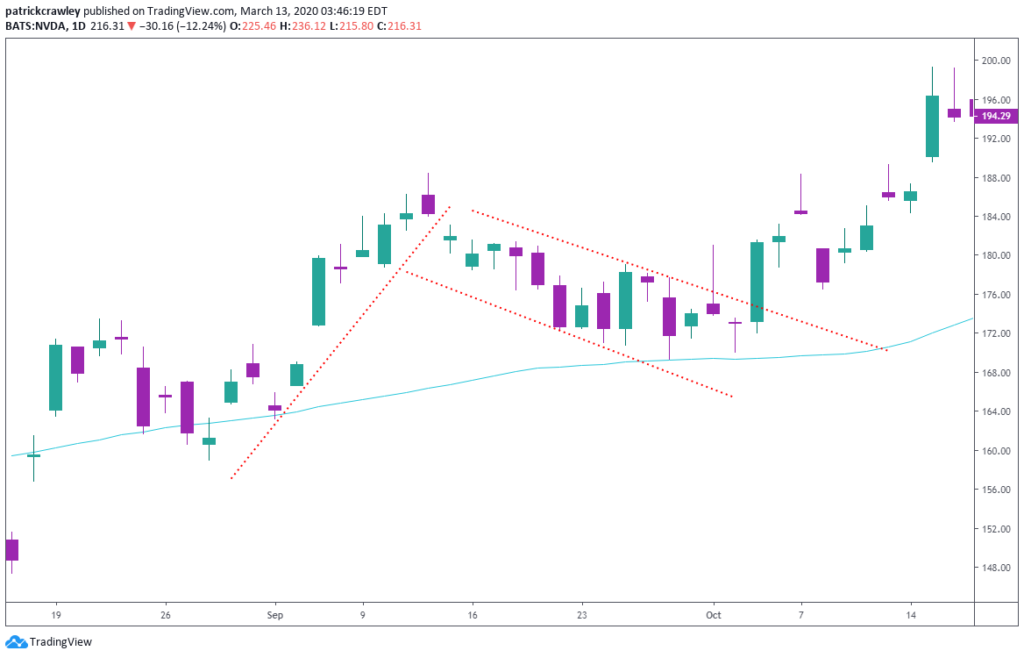

This strategy leans towards being more cautious. When trends take a breather and step back a bit, the bull flag pattern emerges as one of the simpler ones to trade.
Think of a bull flag as a timeout in the middle of an ongoing trend (i.e., a trend pullback), and these pauses often retreat somewhat from the recent high point. Pullbacks usually show promise for a trend continuation.
Effective bull flag patterns often have these key traits:
- Flag pole — an abrupt, strong surge in price accompanied by robust trading volume
- Pullback — following the pole, the price eases back a bit; this step back isn’t as sharp as the pole’s upward thrust
- Flag break — when the boundaries of the flag are breached, it signals the go-ahead for a long position
Every day, you’ll come across numerous bull flag setups in the market. Now, how do you select the right one? Typically, the ones to watch closely exhibit sturdy trading volume and momentum when they’re climbing. As they retreat, their volume and energy levels usually taper off.
Final thoughts
Swing trading provides an accessible entry point for traders looking to dip their toes into the market. Unlike day trading, swing trading doesn’t demand the same constant vigilance. So, beginners can ease into the process, while experienced traders can refine their style.
However, please note that swing trading does require a solid grasp of technical analysis. The need for interpreting charts and numbers becomes crucial as you delve into various patterns and indicators. So, if you’re inclined towards deciphering the intricacies of market trends, swing trading on Binomo could be a good avenue for you to explore.
Swing trading presents a canvas of strategies, and the pursuit of the best swing trading strategy is a personalized journey. With a variety of tactics at your disposal, take your time to explore different approaches. Embrace the process and explore the possibilities!
Sources:
Introduction to swing trading, Investopedia
What is swing trading? Definition, strategies, and example, Business Insider
Swing trading strategies for beginners, Warrior Trading
10 technical trading indicators you must know, Trading Setups Review
Earn profit in 1 minute
+3 <span>Like</span>