
Here is a fascinating story: in the mid-1990s, a young man named Elon Musk founded a company called Zip2. He set a fixed timeline for himself: within a year, he would make Zip2 profitable or shut it down. He knew that this was a bold move, but he believed that it was the only way to push himself and his team to succeed. After a year of hard work, Musk had fulfilled his goal, and the company continued to thrive for several more years before it was eventually sold.
Speaking of setting fixed timelines and achieving goals, there are trading platforms that have taken this concept to a whole new level: Fixed Time Trading, or FTT. In this article, let’s talk about FTT and what technical analysis has to do with it.
Earn profit in 1 minute
What is fixed time trading (FTT)?
Fixed time trading (FTT) is a trading method that involves forecasting whether the price of a particular asset will increase or decrease within a specified time frame. It often relies on technical analysis to analyze various assets, including stocks, currencies, and commodities.
Unlike many other trading methods, FTT doesn’t require the trader to own the underlying asset. They just see the results from rising or falling markets. It is also a fast-paced and exciting way to participate in financial markets, but you must be careful with managing your risks.
Effective strategies in your mailbox
Subscribe and discover a fund of trading knowledge
Great! Please check your email
We’ve sent you an email to confirm your subscription
Something went wrong
Try reloading the page. If that doesn’t help, please try again later
What timeframes to choose for FTT?

In FTT, expiry times can range from as short as a minute to a few hours. While some brokers may offer longer-term trading alternatives, it’s relatively uncommon.
For shorter-term trading, it’s better to avoid trading around news announcements. This is the time when market prices can become highly volatile and challenging to predict accurately. On the other hand, longer-term fixed time trading is largely influenced by fundamental factors (e.g., company performance, economic news, broader market trends, etc.).
Best indicators for FTT
It’s always a good idea to use indicators. But the trick is to use the right ones and to use them properly. Here are a few suggestions for you to try out:
Trading with up to 90% profit
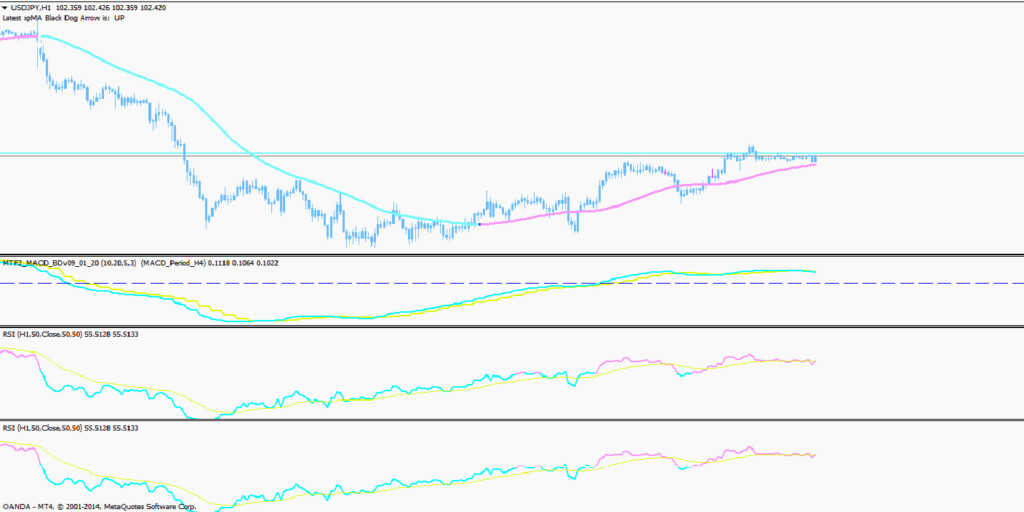
Moving Average
Moving averages smooth out price data over a specified period and provide a visual representation of the average price over time. By plotting MAs on a chart, traders can observe the direction and strength of the trend. This information is crucial for making trading decisions aligned with the prevailing trend.
You may want to look for the crossover of different MAs or the interaction of price with the MA line as potential trading signals.
Stochastic
The Stochastic oscillator helps identify potential overbought and oversold conditions in the market. It can also help identify divergence:
- During bullish divergence, the price takes a quick dip while the Stochastic indicator keeps pushing higher. This hints that the price might bounce back up soon.
- In bearish divergence, the price hits new highs, but the Stochastic indicator starts to drop. This suggests that the price could be gearing up for a decline.
Bollinger Bands
Bollinger Bands are designed to assess volatility and identify potential price reversals. For example, when the price approaches the upper band, you may see a price reversal to the downside and vice versa with the lower band. You can also identify breakouts with further trend continuations or confirm trends based on whether bands are widening or contracting.
5 best coffee types for traders
Coffee is a great beverage for traders. A few daily cups of coffee improves the mind and enables you to make better trading decisions. Check it out!
Read more

Best chart patterns for FTT
Chart patterns are also an important aspect of making decisions in FTT. Let’s look at a few, each with its own unique characteristics and interpretation:
Head and Shoulders and Inverse Head and Shoulders
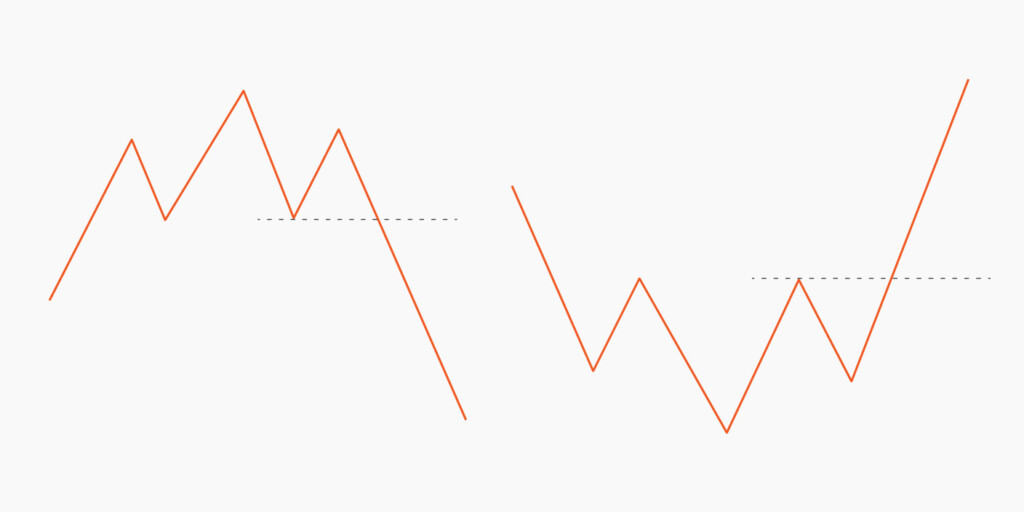
The head and shoulders pattern typically occurs during an uptrend and indicates a potential trend reversal. It consists of three peaks: a central peak (the head) flanked by two smaller peaks (the shoulders). The line connecting the troughs between the peaks is known as the neckline. When the price breaks below the neckline, it suggests a bearish reversal is likely to happen.
Inverse head and shoulders consists of three troughs and a neckline, and when the price breaks above the neckline, there may be a shift from a downtrend to an uptrend.
Double Top and Double Bottom
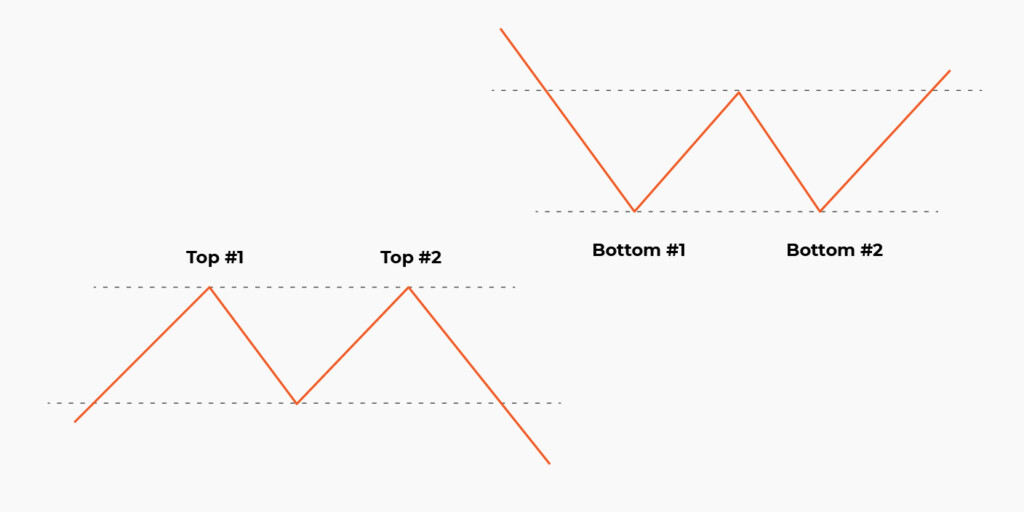
Double top is made up of two consecutive peaks of approximately the same height, separated by a trough in between. When the price breaks below the neckline (the line drawn through the trough), expect a potential bearish reversal.
The double bottom pattern is its bullish counterpart, with two consecutive lows separated by a peak. When the price surges above the neckline drawn through the highs, it signals an auspicious bullish reversal may be on the horizon.
Bullish and Bearish Flag
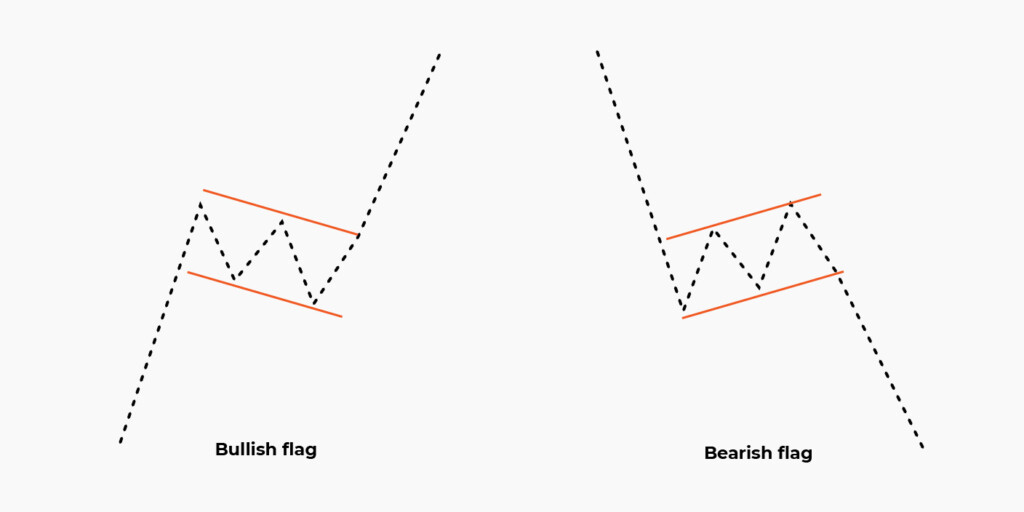
The bullish flag pattern starts with a sharp upward price movement, resembling a flagpole. Afterward, there’s a temporary consolidation period where the price forms a rectangular or pennant-shaped pattern, known as the flag. This consolidation indicates a momentary pause before the uptrend potentially resumes.
With the bearish flag pattern, you see a sharp downward movement followed by the flag. You can interpret this as a brief pause in the ongoing downtrend before it may continue.
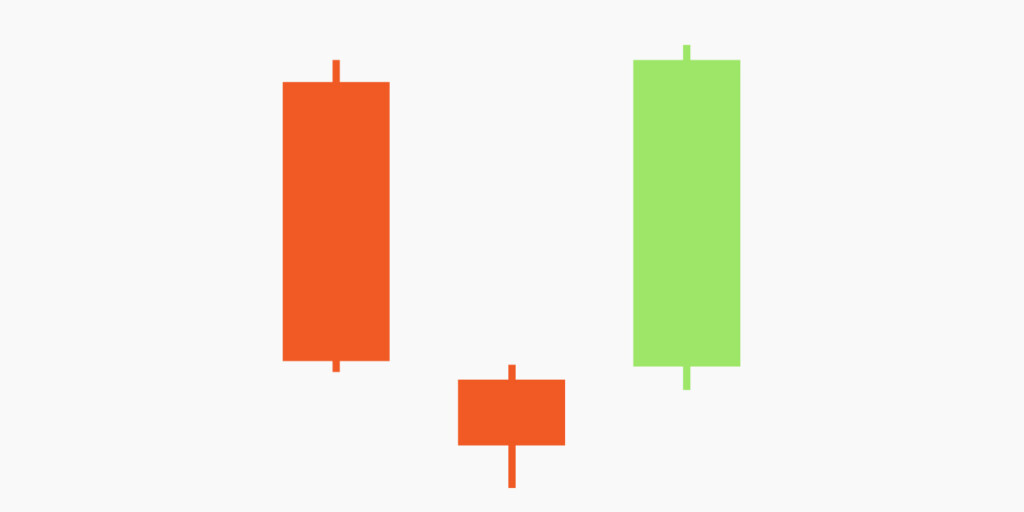
Best candlestick patterns for FTT
Candlestick patterns, especially ranging from one to three candles, are simple yet powerful tools for analyzing price movements. Below are some of the best single candlestick patterns for FTT:
Hammer

Hammer is a single candlestick with a small body and a long lower shadow. The body is typically near the top end of the candle, while the lower shadow extends significantly below the body. The hammer regardless of its color provides a bullish signal. However, if it’s bullish (green or white, depending on the settings), there is a higher chance a downtrend reverses.
Morning Star
Morning star is a three-candlestick pattern that occurs during a downtrend. The first candlestick is a long red (black) candle, the second candlestick is a smaller candle that can be either red (black) or green (white), and the third candlestick is a long green candle. This shows strong buying pressure and a potential bullish reversal.
Engulfing Patterns
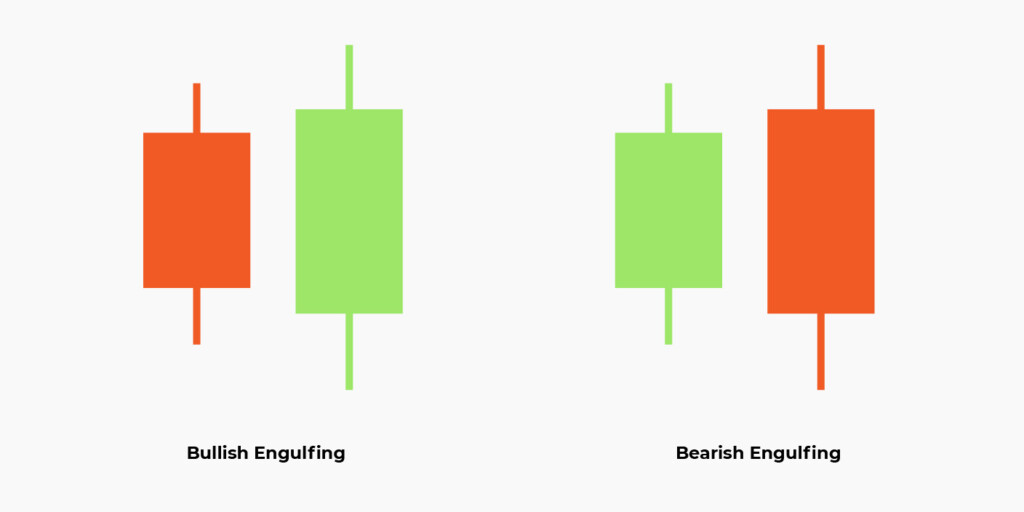
In the bullish engulfing pattern, the first candlestick is red (black), while the second is green (white) and completely engulfs the previous candle. Such a formation points to a potential reversal from a downtrend to an uptrend.
And if you see a green (white) candlestick followed by a red (black) candlestick that completely engulfs the first one, you’re dealing with the bearish engulfing pattern and a possible reversal to a downtrend.
Wrapping Up
In summary, technical analysis plays a crucial role in fixed time trading. By using the appropriate timeframes and combining multiple indicators and chart patterns, traders can get a comprehensive view of the market. With the information gained from TA, they can decide when to enter or exit the market, as well as how to manage their trades.
Please note that technical analysis is not foolproof. So traders should also consider other factors like market news and events, economic data, and geopolitical factors when making trading decisions.
Sources:
7 Technical Indicators to Build a Trading Toolkit, Investopedia
10 Trading Trend Patterns Every Trader Needs to Know, WunderTrading
Start from $10, earn to $1000
+2 <span>Like</span>