
Every rookie trader wants to find a perfect indicator that will provide only accurate signals. There is no such indicator. However, there are indicators that work on different assets, including stocks, cryptocurrencies, currencies, and commodities. Such indicators can be called “the best.”
Start from $10, earn to $1000
Interestingly, many traders believe that the number of successful trades determines the effectiveness of an indicator. It’s a myth. The effectiveness is measured based on the win rate and the income/loss ratio.
1. Relative Strength Index
This tool was presented in 1978 by J. Welles Wilder Jr. It’s called one of the best technical indicators for stocks, but it’s also used to analyze other assets.
Parameters
The indicator has only two parameters — a length and a price. The length is the number of candlesticks used to calculate the RSI, while the price is a price type such as close, open, highest, and lowest. Standard settings are the length of 14 and the close price.
How to use RSI
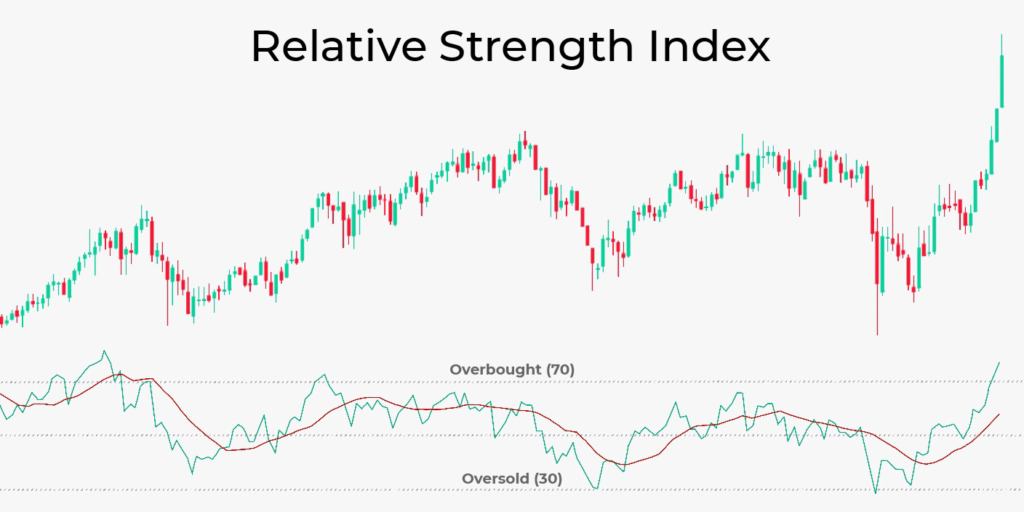
The Relative Strength Index provides two key signals: overbought/oversold price conditions and a divergence.

- Overbought and oversold areas. The RSI indicator is an oscillator. It means it’s located under the price chart and moves within the 0-100 range. When it’s above the 70 level, an asset is overbought, and its price is supposed to fall when the RSI breaks below the level. When the RSI is below the 30 level, an asset is oversold. Its price is supposed to rise when the RSI breaks above the level.
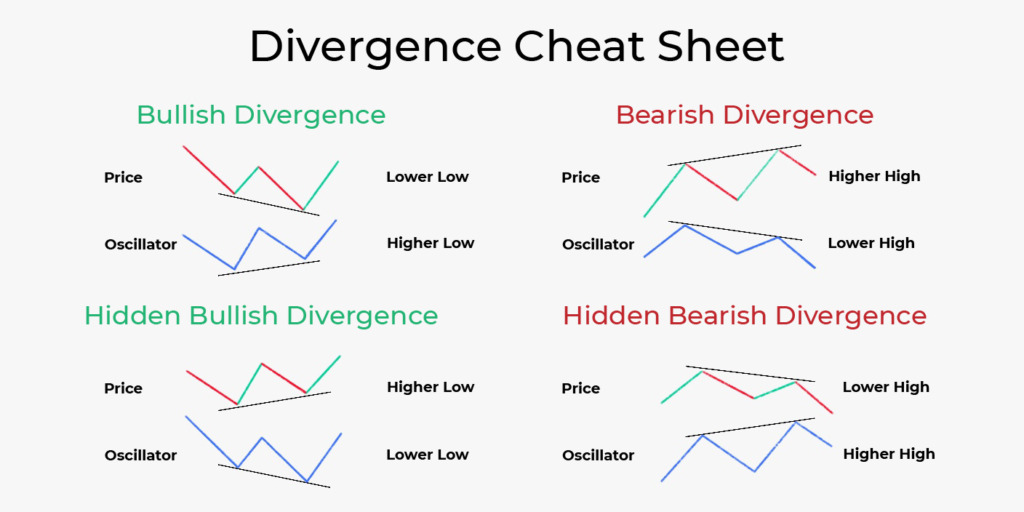
- Divergence. Divergence is a condition when a price and an indicator move in different directions. Below, you can find key divergence rules.
Effective strategies in your mailbox
Subscribe and discover a fund of trading knowledge
Great! Please check your email
We’ve sent you an email to confirm your subscription
Something went wrong
Try reloading the page. If that doesn’t help, please try again later
2. Bollinger Bands
Bollinger Bands is an indicator that identifies support and resistance levels, volatility rate, and market direction. It’s one of the best technical indicators for swing trading.
Parameters
The indicator is based on three settings — a period, a price type, and a standard deviation.
A period is a number of candlesticks used to calculate a simple moving average (SMA). The price type is every candlestick’s close, open, highest, or lowest price. The standard deviation is a deviation from the SMA, which is used to build the upper and lower bands.
The standard settings are a period of 20 and a standard deviation of 2. With these parameters, Bollinger Bands becomes one of the best technical indicators for day trading.
How to use Bollinger Bands
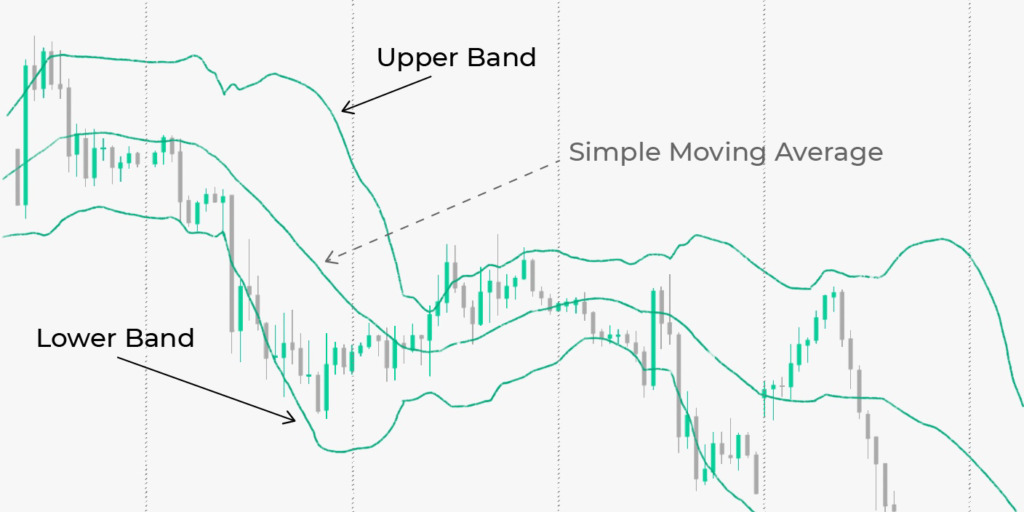
- Support and resistance levels. The indicator consists of three lines. The upper band is a resistance level, the lower band is a support level, and the middle line can be a resistance boundary for rising prices and a support boundary for falling prices.
- Market direction. The middle line allows traders to identify a trend. When a price breaks above it, a market turns bullish. When a price falls below it, a trend turns bearish.
- Volatility. When the bands narrow, volatility is low. When the bands widen, volatility rises.
5 of the best scalping indicators to use right away
You can experiment with various indicators, but there are some you can use right away to build your best scalping strategy.
Read more

3. Volume
The volume indicator is believed to be one of the best technical indicators for crypto because it measures the strength of bulls and bears.
Parameters
The indicator doesn’t have specific settings.
How to use the volume indicator
The indicator can signal a price reversal and short-term price change.
- Price reversal. When price fluctuations become smaller, but volume bars rise, it’s a sign the market will turn around soon. If a price move is accompanied by rising bars of the same direction (green in a rising market and red in a falling market), it’s a sign the price is forming a new trend.
- Short-term price movements. If a price movement isn’t confirmed with an increase in volume, it’s a sign the price may turn around soon.
Takeaway
There is no perfect tool that will be effective for any strategy and timeframe. Every tool must be set based on the market’s unique features and your trading approach.
Trading with up to 90% profit
<span>Like</span>