

This guide is an introduction to the RSIMA baseline divergence indicators and how they contribute to a trader’s success. These arrows or indicators are made to function as filters for diverging signals in the market.
Unique situations prompt these divergences to be visible on the chart. Traders and investors will often discover that if:
The RSIMA is outside 80 overbought; the bearish divergence sign becomes visible on the chart. This is to signal a reversal towards the downside of the graph.
If, on the contrary, the RSIMA moves outside 20 oversold, the countering bullish divergence sign will become visible on the chart. This is to signal a reversal towards the upside of the graph.
In addition to that, an arrow that is positioned in the direction on the chart will be seen once there is the occurrence of a signal. The preset configuration of the RSIMA baseline divergence arrows can also be modified to suit the trader’s preferences.
Earn profit in 1 minute
Setting up RSIMA baseline divergence arrows indicator in MT4
Although you can always find an installation guide to put you through the basics of using your preferred trading platform, this guide section will focus on setting up the RSIMA baseline divergence arrows in MT4.
Formula
—Start by copying and pasting the files that contain the Rsima + baseline (divergence + alerts + arrows).ex4
OR

— Rsima + baseline (divergence + alerts + arrows).mq4 indicator into the MQL4 folder of the Metatrader 4 trading platform. Depending on which trading platform you use, the destination folder may differ.
The destination folder can be accessed by clicking on the menu options right at the top. The folder path is as follows:
—File > Open Data Folder > MQL4 > Indicators (paste the file here).
After pasting the file into the appropriate folder, go to the left-hand side of the terminal in your MT4. From the available navigation, locate the “gauge name”, then right-click on it to select and attach it to your chart.
Effective strategies in your mailbox
Subscribe and discover a fund of trading knowledge
Great! Please check your email
We’ve sent you an email to confirm your subscription
Something went wrong
Try reloading the page. If that doesn’t help, please try again later
Guidelines for trading divergences
Divergences have always been utilized by professional traders who would like to determine whether or not a trend is becoming weaker, which may result in a continuation or trend reversal.
Before the real work begins, we have provided guidelines for trade divergences. You can either memorize them now or bookmark this page to keep coming to learn about them.
Have clean glasses
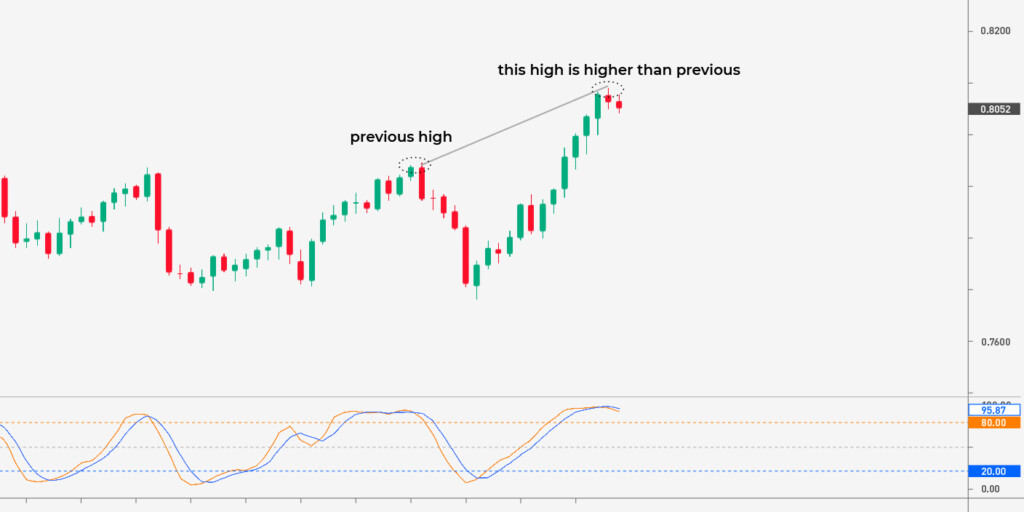
For a divergence to occur on a chart, the market price must have assumed one or more of the following forms:
- A “low” that is lower than the previous
- A “high” is higher than the previous
- A double bottom
- A double top
If any of these scenarios have yet to take place, there is no use looking out for any divergence arrow for trading signals.
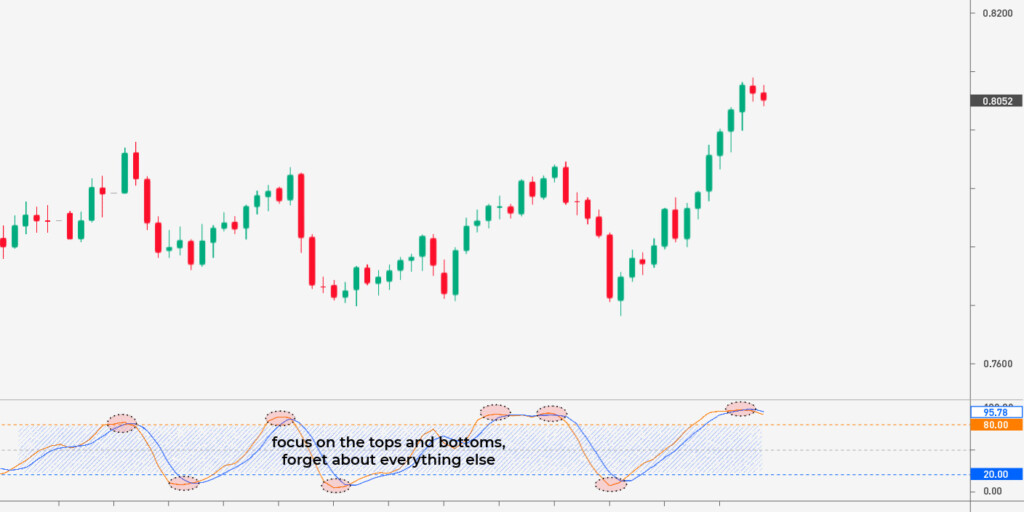
Only connect bottoms and tops
The moment you take note of two price swings that are highs, it is expedient that you connect the tops of both highs. Inversely, it would be best if you also joined the bottoms of two price swings that are lows.
Focus on the price
Another way to trade divergences is to keep a stable focus on the price. Now that you have connected the bottoms and tops, it is time to compare the price action to your favorite technical indicator.
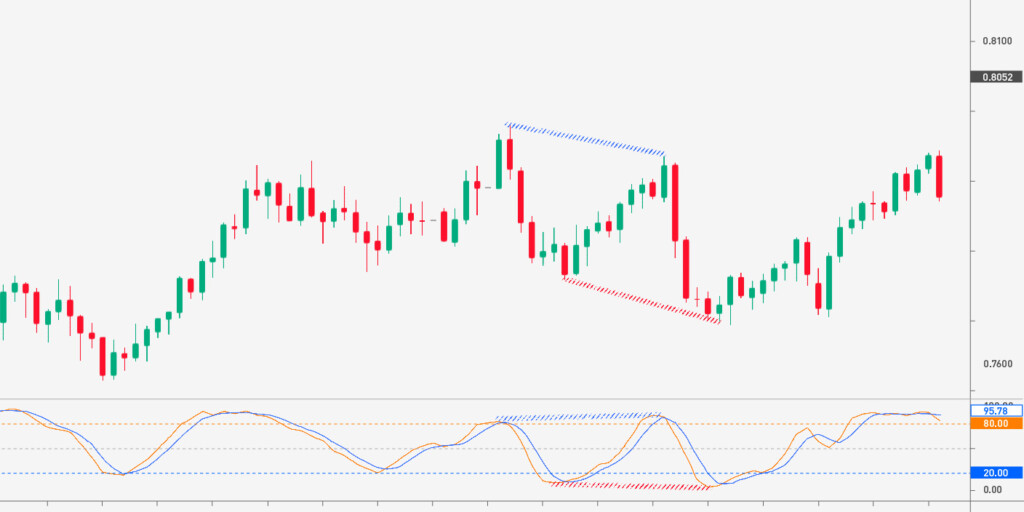
Remain consistent with “highs” and “lows” swings
If, as a trader, you draw a straight line that connects two lows on the price chart, you must also draw a straight line that connects two lows on the indicators. Similarly, if you combine two highs with a line on the price chart, you must also connect two highs on the indicator. Both have to match if you will master trading divergences.
Cryptocurrencies: what to expect in 2023
2023 is expected to be the year of recovery for the crypto market. Read on to see what to expect in 2023 for cryptocurrencies.
Read more

Conclusion
The RSIMA baseline divergence indicators are a worthy addition to your trading repository. However, it is essential to note that traders must have realistic expectations when using these indications.
Similar to other tools used for technical analysis, the RSIMA baseline divergence arrows are not guaranteed to supply 100% accurate signals. They can only do so much, giving the trader enough room to work on their guts and decision-making process.
Start from $10, earn to $1000
<span>Like</span>