
Momentum indicators are technical analysis tools that allow traders to measure the strength of a price’s movements. They are widely used to get signals on a price’s future direction, unlike lagging indicators, which confirm an established trend.
Interestingly, Charles Dow, one of the creators of the well-known Dow Jones Index, developed technical analysis in the 19th century. Back then, traders drew high, low, and close prices of an asset for a day, week, month, or year. Charles discovered that a price moved in cycles and trends regardless of the timeframe.
There are numerous momentum indicators you can implement to get trading signals. However, some have proven their effectiveness. Keep reading to explore them.
Earn profit in 1 minute
MACD
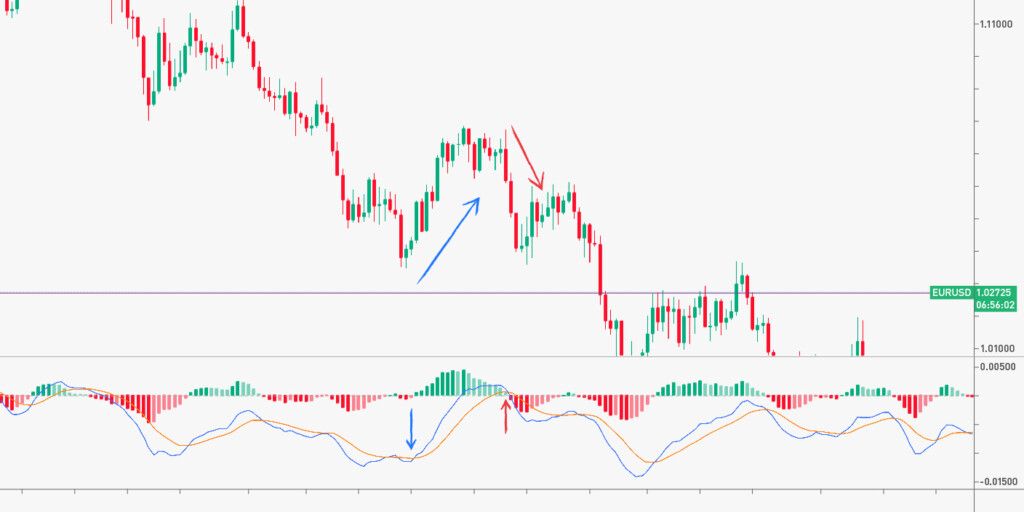
A MACD (moving average convergence divergence) indicator is based on one of the most popular momentum indicators: the moving average. It consists of a histogram and two lines — MACD and signal.
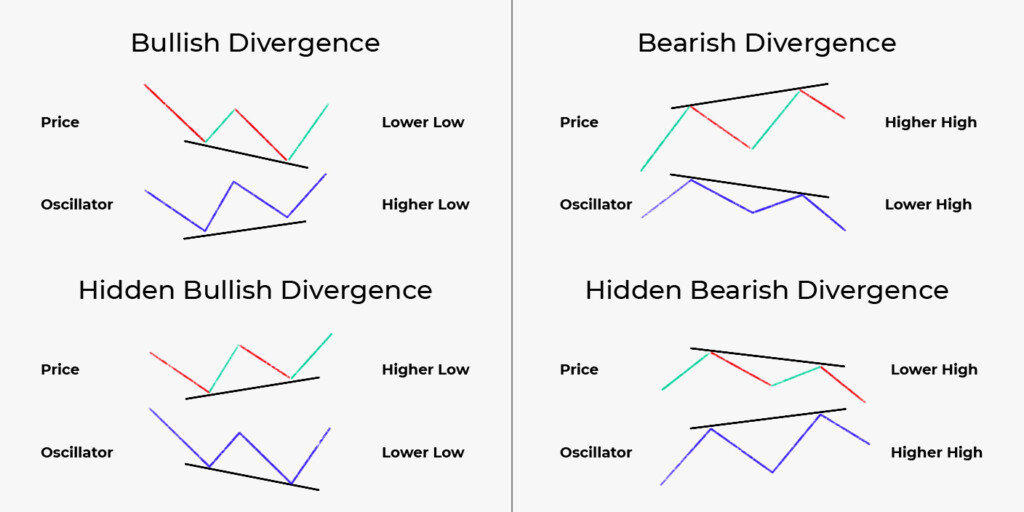
The histogram is mainly used to identify divergence. Divergence is a market condition in which an indicator forms highs or lows that don’t correspond to a price’s highs or lows. This signal allows traders to forecast a change in a price direction.
Another way to use the MACD indicator is to check crossovers of MACD and signal lines. When the MACD line breaks above the signal line, it’s a buy signal. When the MACD line falls below the signal line, it’s a sell signal.
Effective strategies in your mailbox
Subscribe and discover a fund of trading knowledge
Great! Please check your email
We’ve sent you an email to confirm your subscription
Something went wrong
Try reloading the page. If that doesn’t help, please try again later
ADX
An ADX or average directional index is a momentum indicator that reflects a trend’s strength. It may consist of an ADX line or three lines, including ADX, Plus Directional Movement Indicator (+DMI), and Minus Directional Movement Indicator (-DMI). Two additional lines can be used to catch buy and sell signals.
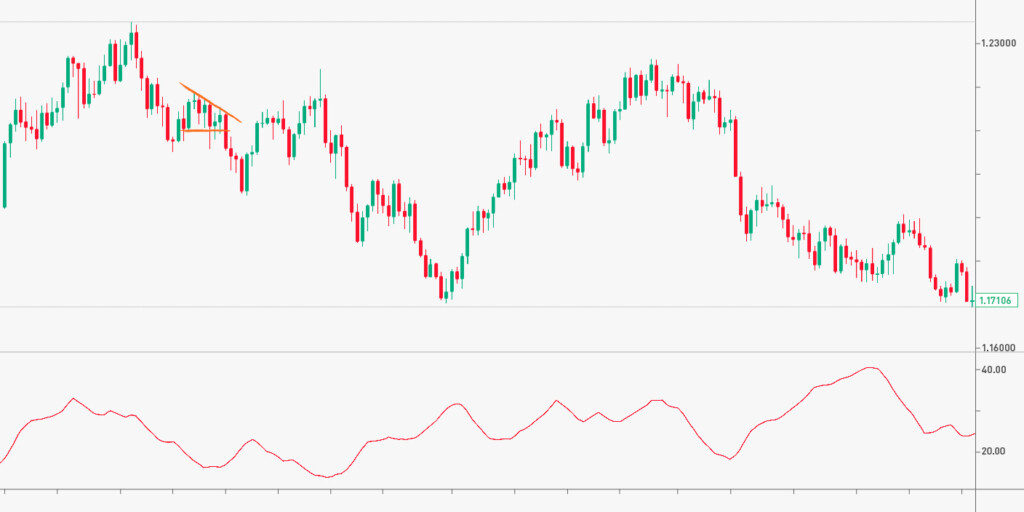

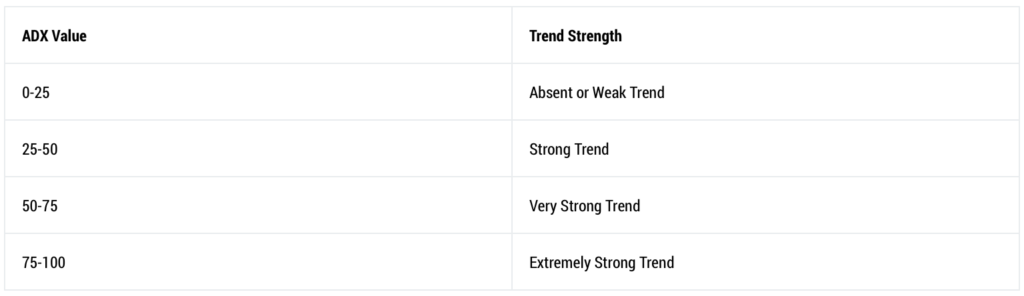
The ADX line itself determines how strong the current trend is. It moves within a 0-100 range.
Note: the indicator doesn’t reflect a trend direction but its strength.
RSI
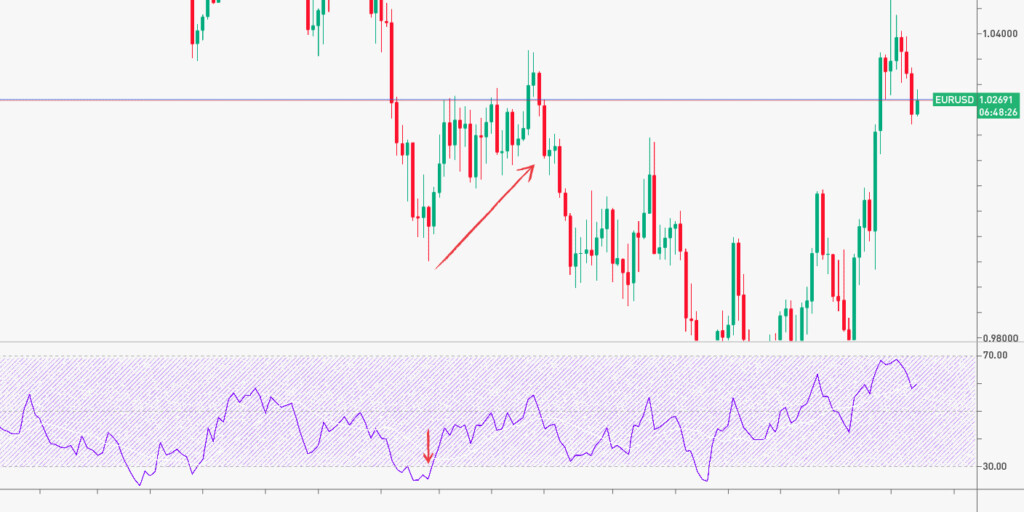
RSI, or the relative strength index, is a momentum indicator that reflects overbought/oversold market conditions. It’s represented by a single line that moves within a 0-100 range.
Start from $10, earn to $1000
- When the line moves in a 0-30 range, it’s a sign of oversold market conditions. When the line breaks above the 30 level, it’s a buy signal.
- Another case is when the line moves in a 70-100 range. It shows overbought market conditions. You can open a sell position when RSI falls below the 70 level.
The RSI indicator can also be used for divergence signals. Rules are the same as for the MACD indicator, but the divergence occurs between a price and the RSI line, not a histogram.
Cryptocurrencies: what to expect in 2023
2023 is expected to be the year of recovery for the crypto market. Read on to see what to expect in 2023 for cryptocurrencies.
Read more

Momentum
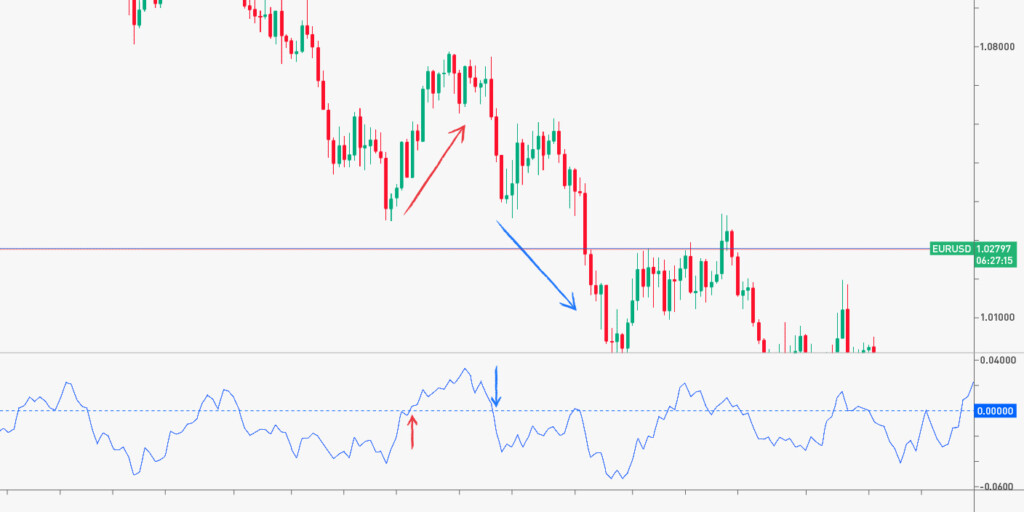
Momentum is an indicator that confirms the strength of buyers/sellers. It consists of one line that fluctuates around a 100 (or 0) level.
If the momentum line rises above the 100 (0) level, it’s a sign an upward movement will continue. As soon as it falls below the 100 (0) level, the price is supposed to keep falling. As with many other momentum indicators, momentum can be used for a divergence signal.
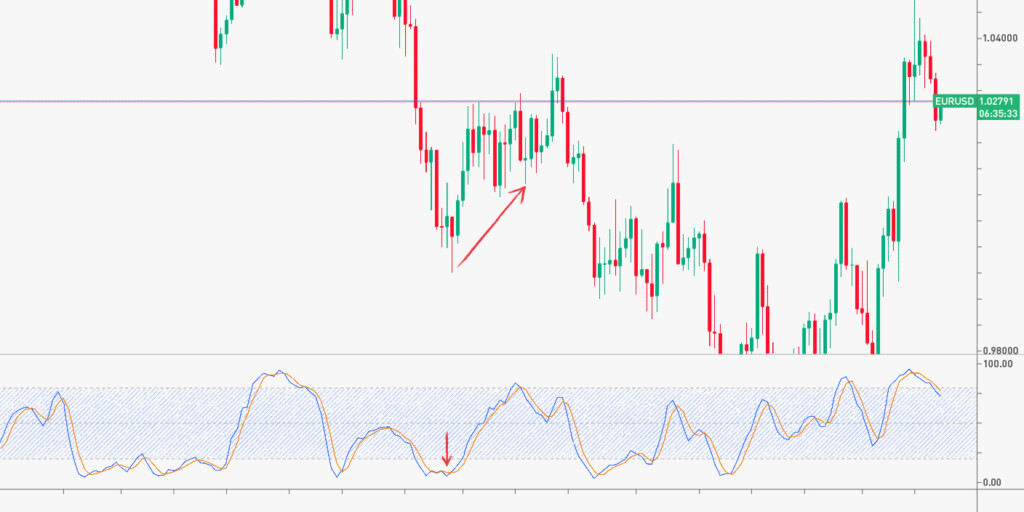
Stochastic
The stochastic indicator is similar to RSI. But it consists of two lines — %K and %D, where %K is a fast line and %D is a slow line. They move within a 0-100 range, the same as the RSI line, but an oversold condition occurs when the lines are in a 0-20 range, and an overbought condition appears when the lines are in an 80-100 range.
You can buy if the slow line breaks above the fast line in the 0-20 range. You can sell if the slow line breaks below the fast line in the 80-100 range. The lines’ highs and lows can also be used for a divergence signal.
Final thoughts
Momentum indicators are an essential part of technical analysis. As every indicator provides several signals, it’s enough to choose 2-3 indicators you will constantly use. But don’t confirm signals of one indicator with signals of a similar one — for instance, RSI and Stochastic.
Trading with up to 90% profit
<span>Like</span>