
In financial markets, uncertainty and unpredictability often reign supreme. Much like the rise of Pokémon Go and Gangnam Style’s viral success, where the convergence of unique factors propelled them to an unprecedented level of popularity, the financial world also experiences its own version of such remarkable situations. These are black swan events.
Among many tools to navigate the currents of the financial world and black swan events, the parabolic SAR indicator stands out as a promising contender.
Trading with up to 90% profit
What are black swan events?
A black swan event is an unforeseen occurrence that significantly deviates from what’s normally expected. These events stand out due to their extreme rarity, profound impact, and the subsequent tendency for observers to claim they should have predicted them after the fact.
The term “black swan” gained prominence through Nassim Nicholas Taleb, a finance academic and author who introduced the concept prior to the 2008 financial crisis. According to Taleb, people often rationalize these events as though they were foreseeable all along. However, black swans, by their nature, defy conventional forecasting models.

If you’re wondering where the name comes from, it finds its origin in the rarity of black swans themselves. The narrative suggests that black swans were initially considered non-existent until a discovery eventually confirmed their existence. And if you hear anything about a gray swan event, keep in mind that it’s an outlier occurrence that, while still uncommon, is relatively more probable than a black swan event.
Examples of past black swan events
The 2001 dotcom bubble serves as a classic illustration of a black swan event. During this time, the internet was still in its infancy, with only a limited number of online commercial applications in use.
However, technology companies were intensely investing in expansion, which resulted in inflated stock prices for these enterprises. As the bubble grew, numerous companies faced financial troubles, defaults began, and stock prices plummeted. The result was a rapid succession of business shutdowns, and it exacerbated the decline in stock prices.
Another notable black swan event was the 2008 housing market crash. In the years leading up to 2008, relaxed standards for home mortgages led to an inflation of housing market values. This eventually reached bubble-like proportions due to the increased issuance of subprime mortgages. Financial institutions capitalized on this situation and created mortgage-backed securities that encouraged riskier lending practices.
Eventually, the housing market bubble burst, leading to a wave of homeowner mortgage defaults, which in turn inflicted harm on the broader market.
Effective strategies in your mailbox
Subscribe and discover a fund of trading knowledge
Great! Please check your email
We’ve sent you an email to confirm your subscription
Something went wrong
Try reloading the page. If that doesn’t help, please try again later
Introduction to parabolic SAR
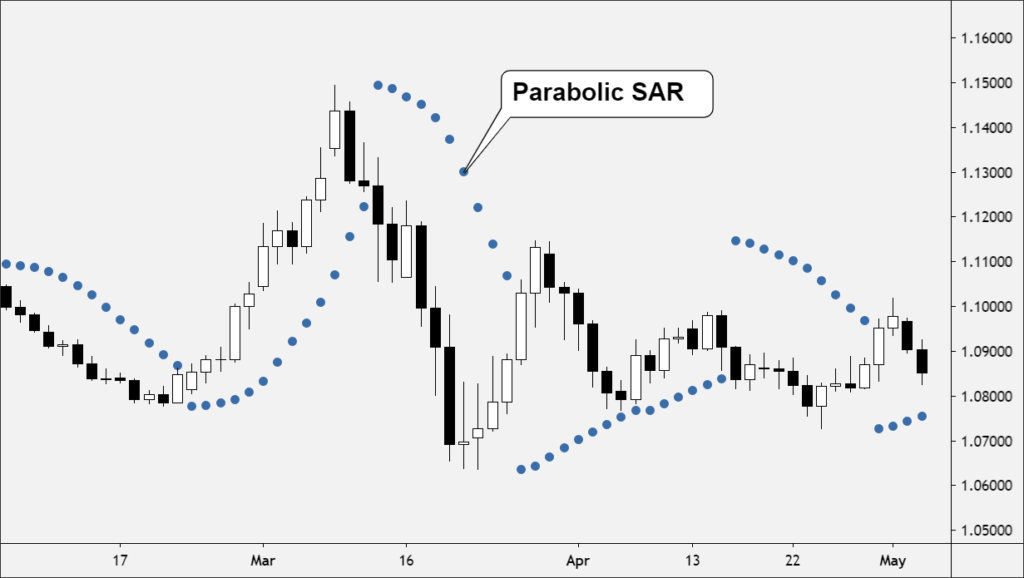
The parabolic SAR is a vital technical indicator conceived by J. Welles Wilder and designed to decipher the trajectory of an asset’s movement. It serves the purpose of detecting potential shifts in the price trajectory of traded assets; moreover, it extends its utility to providing cues for optimal entry and exit points.
The indicator creates a curved pattern on price charts, outlining potential points for halting and reversing trends. This pattern’s resemblance to the parabolic curve from classical geometry and mechanics inspired its name.
Primarily effective within trending markets, the parabolic SAR’s operational framework involves first establishing the prevailing trend direction. Then, traders can complement this information with alternative indicators to gauge the robustness of the identified trend.

What does SAR mean? SAR. This abbreviation encapsulates the methodology employed by the indicator — a stop and reverse technique. In simple terms, the parabolic SAR uses a trailing stop and reverse mechanism to pinpoint opportune junctures for entering or exiting a trade. This ability to dynamically adjust its positioning based on price movements provides traders with actionable insights.
How to сalculate parabolic SAR
The indicator uses the highest and lowest price points, along with an acceleration factor, to determine where to place a dot on a chart. To calculate the parabolic SAR, you need to consider whether the market is in an uptrend or a downtrend. In an uptrend, the dot is calculated using the formula:
Start from $10, earn to $1000
Uptrend parabolic SAR = Prior SAR + Prior AF (Prior EP – Prior SAR)
And in a downtrend, the formula is:
Downtrend parabolic SAR = Prior SAR – Prior AF (Prior SAR – Prior EP)
Here’s what each part of the formula means:
- Prior SAR: the parabolic SAR value from the previous period.
- Prior AF: the acceleration factor used for calculating the current period’s Parabolic SAR value. It starts at 0.02 and is increased by 0.02 every time a new extreme point is recorded (max 0.20).
- Prior EP: the extreme point of the current trend. In an uptrend, it’s the highest price reached, and in a downtrend, it’s the lowest price reached.
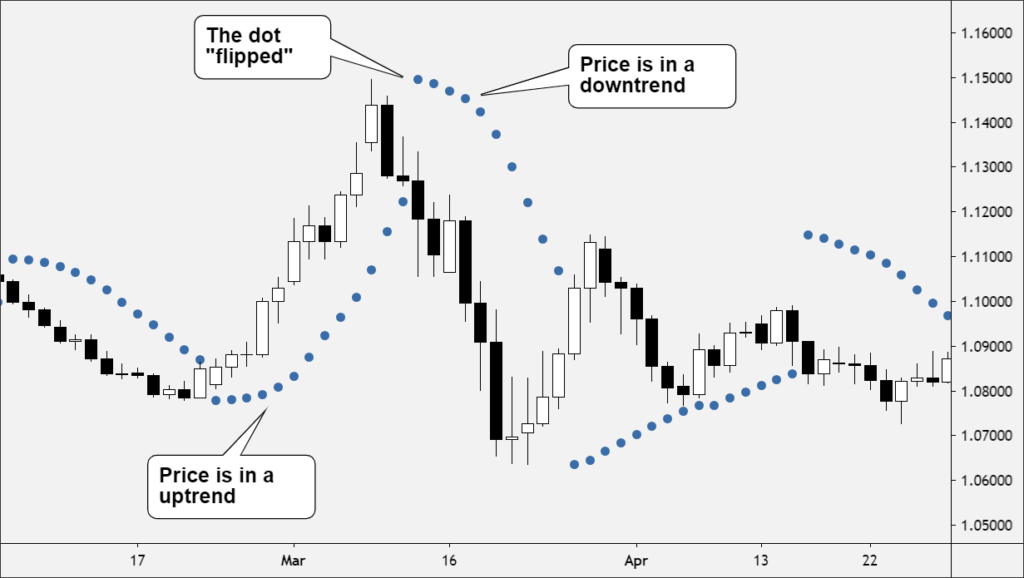
When these calculations are done, they result in a dot that is plotted on the price chart. This dot can be either above or below the current price, depending on the trend direction. The purpose of these dots is to help traders understand the ongoing trend direction:
- When dots are below the price = an uptrend
- When dots are above the price = a downtrend
How to start trading with $200 and minimum risk
Don’t let a small budget deter you from trading! Learn how to start trading with $100 or $200 and make the most out of this money!
Read more

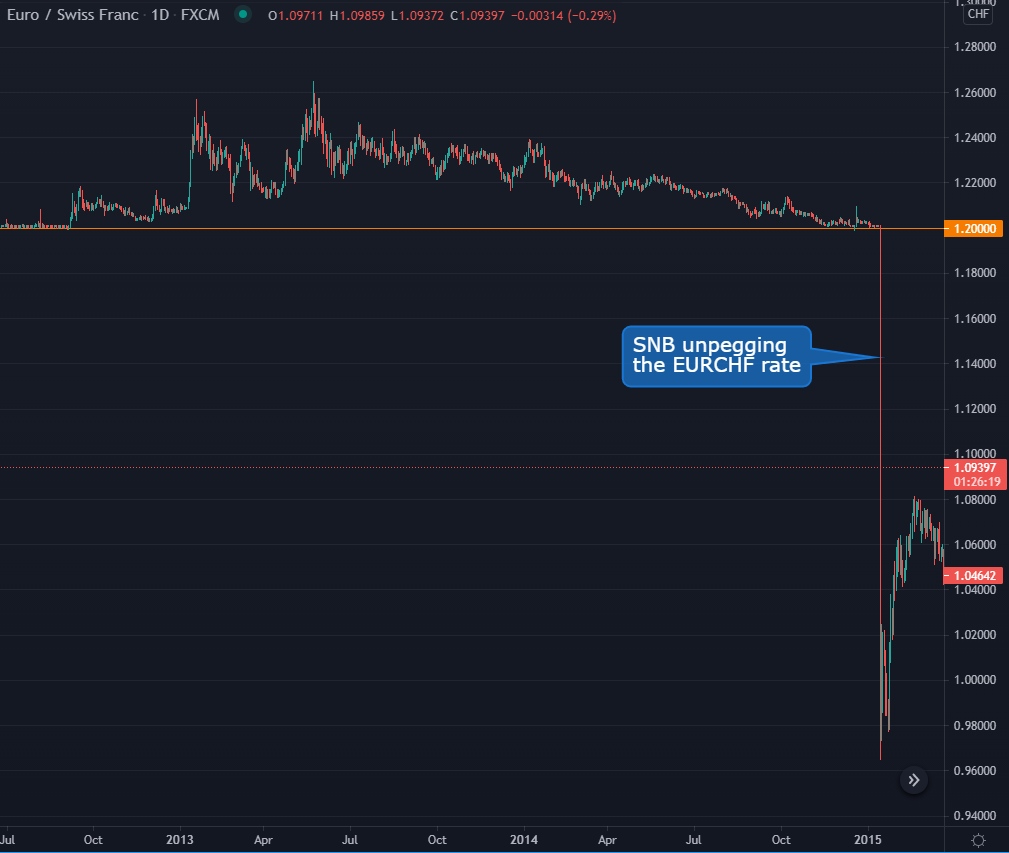
Applying parabolic SAR to identify black swan events
When the market experiences higher volatility — a hallmark of black swan events — the parabolic SAR dots are placed farther away from the price and each other. This wider gap accommodates the bigger price swings that are common during volatile periods as if it’s giving the price more room to move around without triggering a signal too soon amidst the storm.
In contrast, when the market’s volatility is lower, the dots get closer to the price and each other. This narrower gap reflects the smaller price fluctuations expected in calmer market conditions. Essentially, the indicator becomes more sensitive to smaller price changes during these times.
Identifying potential reversals
The parabolic SAR strategy can be used to spot potential trend reversals — traders should keep an eye on the dots’ movement and how they relate to the price of the asset. When the dots switch from being above the price to below it or the other way around, it might be a sign that a trend reversal could be in the works.
For example, if the dots shift from above the price to below it, it could imply that a downward trend might be turning into an upward one. Similarly, if the dots move from below the price to above it, it could mean that an upward trend might be transitioning to a downward one.
Risk management
During the uncertainties of black swans, traders and investors can enhance their risk management strategy by combining the parabolic SAR with other tools. For instance, setting a stop loss aligned with the indicator’s signals provides a dynamic exit plan. Moreover, using it alongside position management strategies can optimize risk-reward ratios.
Diversification emerges as another potent shield against black swan events. By trading diverse assets in the first place, traders dilute the impact of a severe decline in any one asset. Plus, consider establishing positions that counterbalance the risk of other positions, i.e., hedging. This way, you may be able to cushion the impact of extreme market fluctuations.
Limitations of parabolic SAR for black swans
The parabolic SAR indicator generates signals all the time, regardless of the presence of a discernible market trend, which can lead to false signals.
Additionally, it produces reversal signals based on its formula, not necessarily on actual price reversals. This formula, designed to detect potential shifts in market direction, can trigger premature alerts when the indicator converges with the price — a phenomenon unrelated to authentic trend reversals. This could make traders exit trades prematurely.
These limitations may be more problematic in the context of black swan events. Reacting to false signals or prematurely exiting positions based on unverified indications might amplify the impact of these already severe events. Traders must recognize that no single indicator, including the parabolic SAR, can reliably predict or safeguard against these unique events. So, don’t put yourself at more risk than needed by excessively relying on just one tool.
Conclusion
While the fundamental functionality of the parabolic SAR remains consistent, its interpretation and implications make sense for different use cases. For instance, its sensitivity to abrupt market shifts and volatility makes it a tool worth considering for detecting black swan events.
But you should recognize that the parabolic SAR, while adaptable, remains just one piece of the puzzle. The complexity of such events demands a comprehensive approach that combines multiple indicators, risk assessment techniques, and strategic planning. Nevertheless, the parabolic SAR’s presence as one of the indicators available on Binomo proves its relevance.
Sources:
Black swan in the stock market: what is it, with examples and history, Investopedia
Parabolic SAR – overview, how it works, and how to calculate, Corporate Finance Institute
Earn profit in 1 minute
+1 <span>Like</span>