

Average True Range, or ATR, was created by J. Welles Wilder, who applied his knowledge of mechanical systems to develop technical indicators for the financial markets. By the way, did you know that he was a skilled pilot and flew his own plane to travel between trading seminars? That’s quite a range of talents.
Anyway, back to ATR, a valuable tool for traders looking to manage risk and optimize their trading strategies. Here are the basics you should know:
Start from $10, earn to $1000
What is ATR in trading?
ATR is a technical analysis indicator introduced in the book called New Concepts in Technical Trading Systems in 1978. The indicator measures market volatility by breaking down the entire range of an asset’s price for a specific period. The default time period used for the ATR indicator is 14 days.
To calculate ATR, Wilder used a formula based on a series of true ranges (TRs). TR is the highest value of the following three:
- Today’s high minus yesterday’s close
- Today’s low minus yesterday’s close
- Today’s high minus today’s low
ATR = (Previous ATR * (n – 1) + TR) / n,
where n is the number of periods
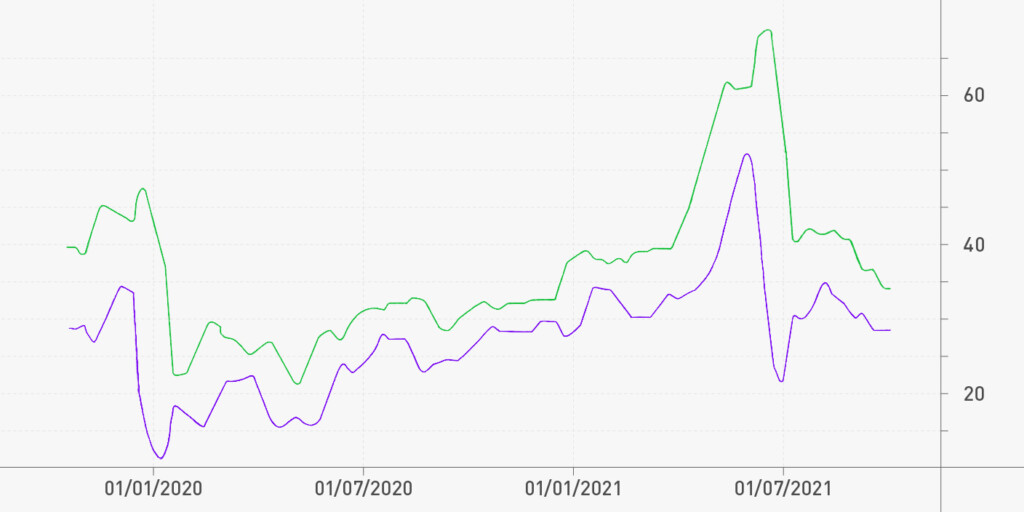
The ATR is then recalculated at each time period, which could be every minute on a one-minute chart or every day on a daily chart. By plotting these ATR readings on a graph, you can observe a continuous line that shows how volatility has evolved over time.

You can adjust the ATR indicator to fit different trading styles and preferences. If you want to make more trades, you can use a shorter time period for more frequent signals. But if your trading activity is more sparse and you need fewer but potentially more reliable signals, consider using a longer time period.
Effective strategies in your mailbox
Subscribe and discover a fund of trading knowledge
Great! Please check your email
We’ve sent you an email to confirm your subscription
Something went wrong
Try reloading the page. If that doesn’t help, please try again later
How to use the ATR indicator
Now, let’s see how ATR can help you in trading.
The higher the ATR value, the more volatile the asset is over that period, and vice versa. You can use this information to make decisions on entering or exiting trades. For example, if the ATR value is high, it could indicate that the asset is experiencing significant price movements and increased volatility. This may present an opportunity for traders to enter a trade and capitalize on the price fluctuations.
This information from ATR can be very helpful for setting profit targets. If you’re a day trader looking to enter a trade, you can consult ATR to see how much that asset has moved on average in recent sessions. And then, you’ll be able to set profit targets that are based on the asset’s typical price movements and therefore are realistic and achievable.
Example in trading
Let’s say you’re looking at stock ABC and calculate its previous 14-day ATR to be $2. Today, you notice that the stock has a high of $32, a low of $29, and closed at $30 yesterday. Using the TR formula, you find that the current true range is $3. If the ATR for the previous 13 days was $2, the stock’s average true range would be $2.07 (($2 x 13) + $3) / 14. You can use this data to identify trading opportunities. If the price has already moved significantly more than the average ATR, it may be a sign that the price is likely to fall back down or stay within the established range.
Alternatively, let’s say the price is near the low of the day, and the price range is larger than usual. It may be a sign that the price is likely to move up and stay within the established range.
Pros and cons of ATR
Here is a short breakdown of what’s good about ATR:
Earn profit in 1 minute
- Useful tool for managing risk and optimizing trading strategies
- Versatile, can be used in various trading styles, including day trading, swing trading, and position trading
- Can be applied to a variety of financial instruments, such as cryptocurrencies, commodities, stocks, and more
- Works well with other indicators for a more comprehensive trading strategy
Now, let’s see where the indicator falls short:
- Doesn’t determine the direction of price movements, which sometimes provides mixed signals
- Subject to a degree of subjectivity (as with all indicators)
- Should not be used in isolation

How to combine ATR with other indicators
Since ATR only measures volatility, you should combine it with other indicators to identify qualified trading opportunities. Here are a few suggestions:
- ATR + MA: For example, adding a SMA can provide a signal line for the ATR. When the ATR rises and the price breaks above the MA, it confirms an uptrend, and traders can consider placing buy orders. Or the other way around, when the price crosses below the SMA and the ATR rises, it confirms a downtrend, and traders may consider placing sell orders.
- ATR + Parabolic SAR: During a strong trend, traders can use the Parabolic SAR to confirm the trend direction while using the ATR to place stop-loss orders to limit their risk exposure.
- ATR + Stochastic: The ATR helps qualify the level of volatility, and the Stochastics helps identify buy/sell signals with overbought and oversold zones. With this combo, you’re able to determine when the price is likely to change its direction (if the Stochastic leaves an overbought/oversold area and the ATR increases).
Summary
If you’re a trader looking for a versatile tool to help you navigate the ups and downs of the markets, the average true range indicator can be a valuable addition to your toolkit.
What makes ATR so popular among traders? It’s simple: the indicator’s ability to measure market volatility, which is useful for managing risk and optimizing trading strategies. And, since ATR can be combined with other indicators to confirm signals, the possibilities for using it are vast. It’s no wonder why ATR has become a go-to tool for traders around the world.
Sources:
What Is the Average True Range (ATR) in Trading? The Balance
Average True Range (ATR) Formula, What It Means, and How to Use It, Investopedia
Trading with up to 90% profit
+2 <span>Like</span>